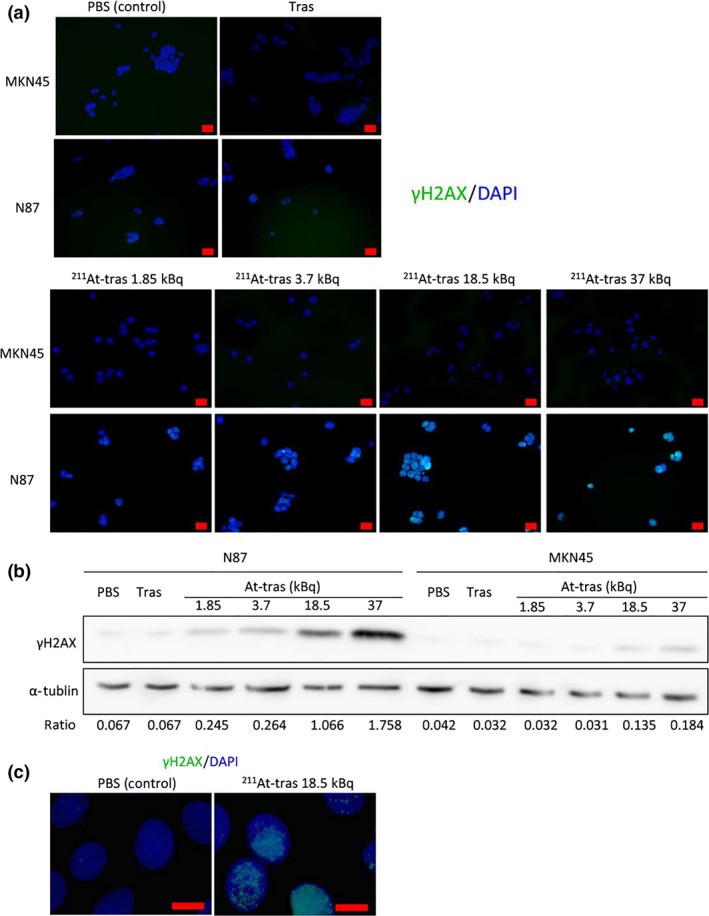
Figure 6.

Images and quantitative analyses of γH2AX foci in cells after treatment with astatine‐211‐labeled trastuzumab (211At‐tras). (a) Immunofluorescence images of γH2AX foci in MKN45 and N87 cells treated with PBS, unlabeled trastuzumab (Tras) or 211At‐tras (1.85, 3.7, 18.5, or 37 kBq). Scale bar = 20 μm. (b) Western blot analysis of γH2AX expression in N87 and MKN45 cells treated with PBS, Tras, or 211At‐tras (1.85, 3.7, 18.5, or 37 kBq). α‐Tubulin was used as a loading control. Ratios of the band intensity of γH2AX relative to that of α‐tubulin are indicated below the images. (c) γH2AX foci in N87 cells treated with PBS or 18.5 kBq 211At‐tras. Scale bar = 10 μm.
