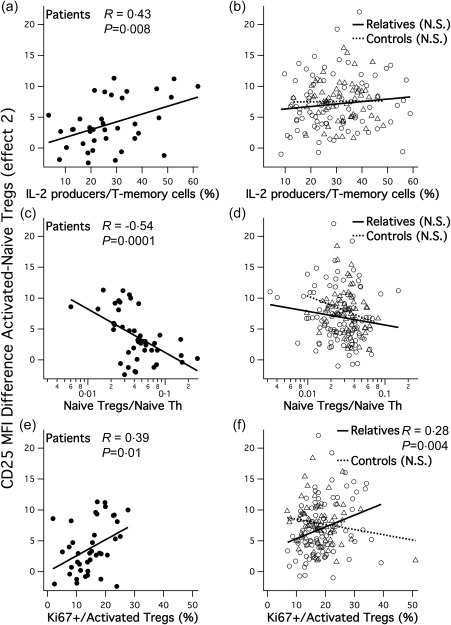
Figure 5.

Characteristics of surface CD25 up‐regulation levels by activated regulatory T cells (Tregs). (a,b) CD25 up‐regulation correlates with proportions of interleukin (IL)‐2‐producing T memory cells upon phorbol myristate acetate/ionomycin (PMA/I) stimulation in systemic lupus erythematosus (SLE) patients but not in relatives or controls. (c,d) CD25 up‐regulation correlates with reduced naive Tregs relative to naive conventional T helper (Th) cells in SLE patients but not in relatives or controls. (e,f) CD25 up‐regulation correlates with Ki67+ proliferating fractions of activated Tregs in SLE patients and relatives but not in controls. (b,d,f) Circles and full regression lines indicate unaffected relatives; triangles and pointed lines indicate unrelated controls. Linear correlation coefficients (R) and significant P‐values are shown; n.s. = non‐significant.
