Figure 5.

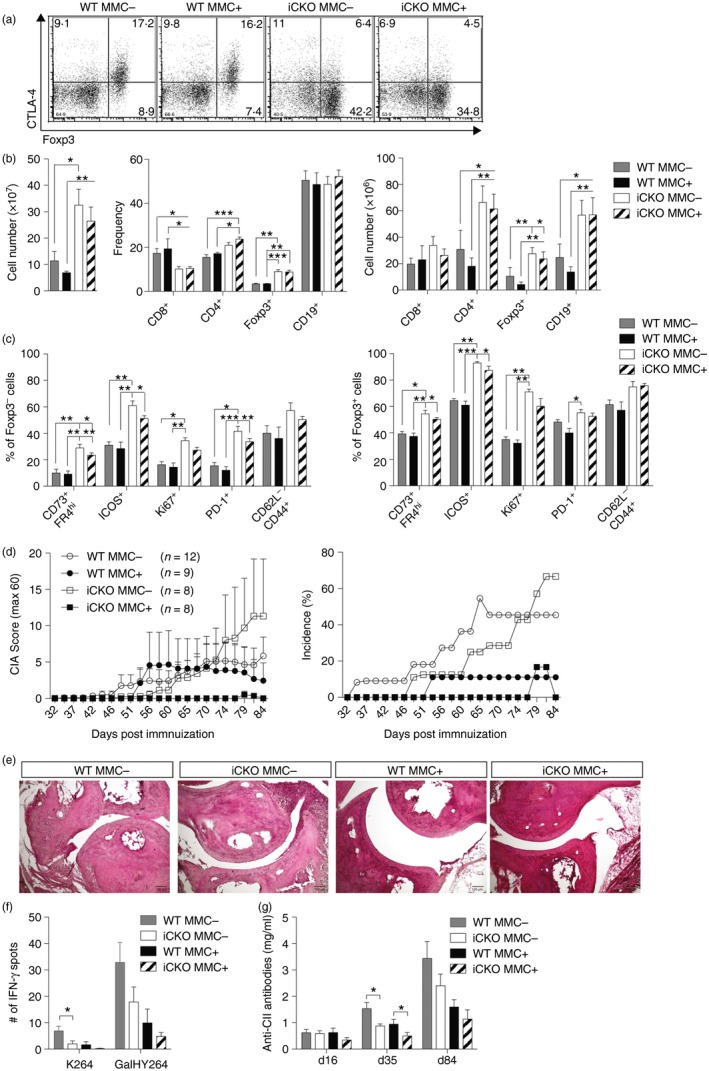
Cytotoxic T‐lymphocyte antigen‐4 (CTLA‐4) expression on both conventional T (Tconv) and regulatory T (Treg) cells regulates tolerance to collagen type‐II (CII) but at different stages. (a) Dot plots of CTLA‐4 expression levels in wild‐type (WT) and inducible conditional knockout (iCKO) mice depleted before immunization, day 84 after collagen‐induced arthritis (CIA). (b) Absolute number (left) of mixed spleen and draining lymph node (dLN) cells and frequencies (middle) as well as total numbers (right) of lymphocyte subsets 84 days after CIA and CTLA‐4 depleted before immunization. (c) Activation markers of CD4+ FOXP3− Tconv cells (left) and CD4+ FOXP3+ Treg cells (right) 84 days after CIA. (d) Arthritis score (left) and incidence (right) of WT MMC + or MMC − and iCKO MMC + or MMC − mice that were CTLA‐4 depleted before immunization. (e) Representative images of WT MMC + or MMC − and iCKO MMC + or MMC − joint sections stained with haematoxylin & eosin, 25× magnification. (f) Interferon‐γ (IFN‐γ) T‐cell response against unmodified (K264) or galactosylated (GalHy264) CII peptides, minus response to RPMI medium, determined by ELISPOT from pooled draining lymph node and spleen cells 84 days after immunization. (g) Total anti‐CII antibody titres in serum of WT MMC + or MMC − and iCKO MMC + or MMC − mice depleted before immunization. Statistical analysis: (b,c) Kruskal–Wallis with Dunn's multiple comparison test, (f,g) Mann–Whitney comparing WT MMC − with iCKO MMC − and WT MMC + with iCKO MMC +. Error bars represent mean ± SEM. Differences were considered statistically significant with *P < 0·05, **P < 0·01, or ***P < 0·001. [Colour figure can be viewed at wileyonlinelibrary.com]
