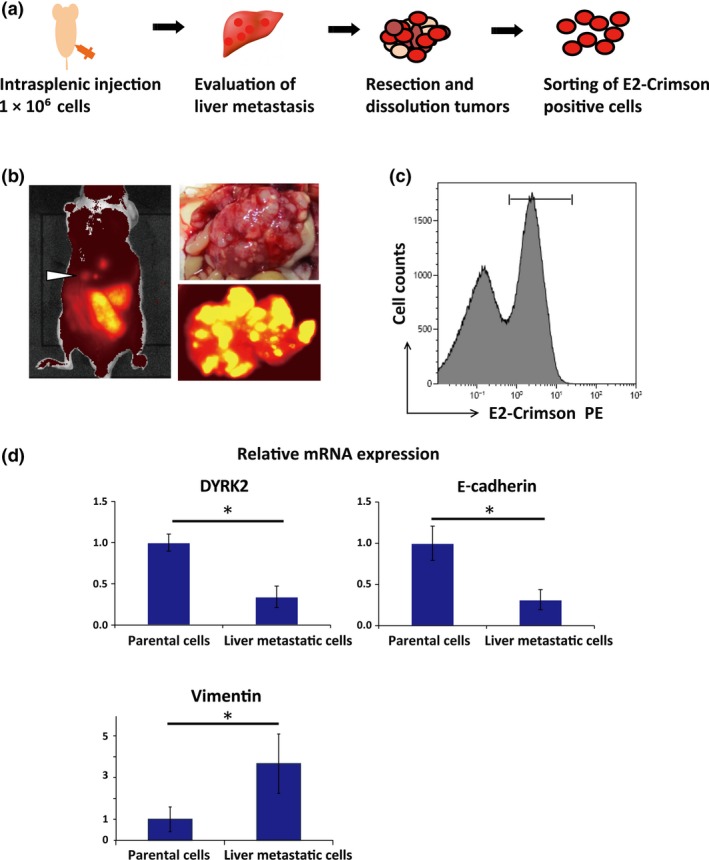
Figure 2.

Development and assessment of liver metastases in a mouse model of colorectal cancer. (a) Schematic representation of in vivo selection and isolation of liver metastatic cells. Cells were injected into the spleen of nude mice to generate liver metastases. At 5 weeks after injection, the liver metastatic lesions were resected and minced. After cells were dissociated, E2‐crimson‐positive cells were sorted and collected. (b) Representative image of liver metastases and In Vivo Imaging System luminescent images in the animals and liver inoculated with colorectal cancer cells (HCT116‐E2). Liver metastatic lesions were identified as white masses. (c) Flow cytometric analysis and isolation of E2‐Crimson‐positive HCT116 cells from liver metastases. Cells were gated by fluorescence intensity (as E2‐Crimson‐positive) and cells derived from mice were removed. E2‐Crimson‐positive cells were isolated and collected from the liver tumors. (d) Expression of dual‐specificity tyrosine‐regulated kinase 2 (DYRK2) and E‐cadherin in cell lines. Relative mRNA expression of DYRK2, E‐cadherin, and vimentin was analyzed by real‐time RT‐PCR in parental cells and isolated cells from liver metastases. Data are displayed as mean ± SD (n = 3). *P < 0.05. n.s., not significant.
