Fig. 1.

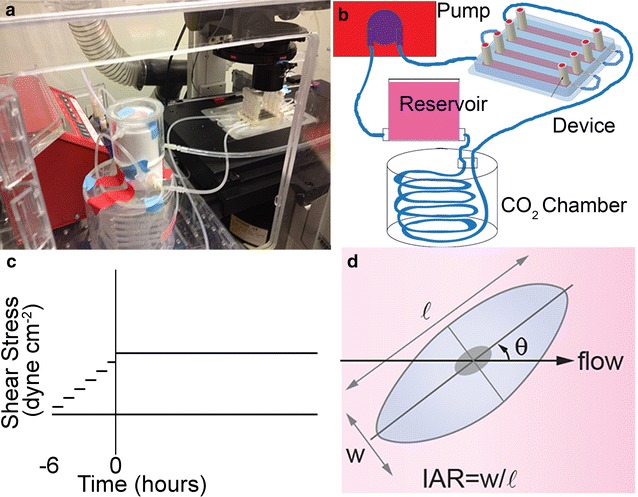
Microfluidic platform. a Image of a device and flow loop in the live cell chamber on the microscope. b Schematic illustration of the flow loop including: a peristaltic pump, a media reservoir, a CO2 chamber, and the microfluidic device. c Profile of the applied shear stress during experiments. On forming a confluent monolayer, the shear stress is increased stepwise over 6 h to a maximum flow rate of 10 mL min−1 for the duration of the experiment. d Schematic illustration of an endothelial cell illustrating the morphological parameters of interest, l length of long axis, w length of short axis, IAR inverse aspect ratio (w/l), θ orientation angle of long axis with respect to flow direction
