Fig. 7.

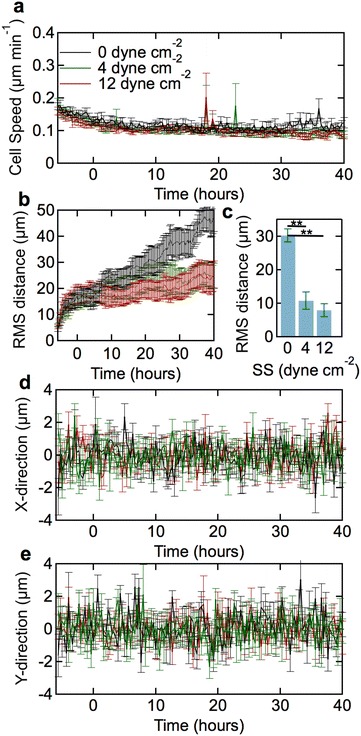
Average speed and displacement of dhBMECs in confluent monolayers at 0 (static), 4, and 12 dyne cm−2. a PIV cell speed as a function of time. Each point represents the average of 18,000 cells over three independent experiments. b RMS displacement as a function of time. c Total cell displacement between 0 and 40 h. d Directionality along the x-axis as a function of time. Positive x-axis corresponds to the direction of flow. e Directionality along the y-axis (perpendicular to the flow direction) as a function of time. Data for displacement and directionality were obtained from analysis of at least 100 cells over three independent experiments. Error bars represent mean ± SE
