Fig. 1.

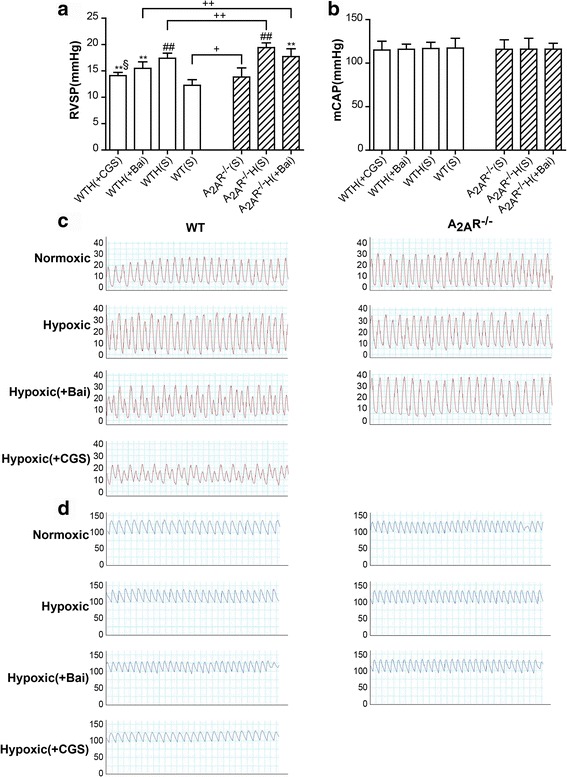
The A2AR and baicalin alleviated RVSP in the hypoxia-induced PAH mouse model. Effects of baicalin (+Bai, 60 mg/kg/day) and CGS21680 (+CGS, 0.25 mg/kg/day) on RVSP (a; n = 8) and mCAP (b; n = 8) in WT and A2AR−/− mice. Representative images of RVSP waves (red) from the WT and A2AR−/− groups (c). Representative images of mCAP waves (blue) from the WT and A2AR−/− groups (d). Data are presented as the mean ± standard deviation (SD). #Value significantly greater than the corresponding value in saline-treated normoxic mice (# P < 0.05, ## P < 0.01). *Value significantly less than the corresponding value in hypoxic mice (*P < 0.05, **P < 0.01). §Value significantly less than the corresponding value in baicalin-treated mice (§ P < 0.05, §§ P < 0.01). +Value significantly greater than the corresponding value in WT saline-treated mice, WT hypoxic mice, and WT baicalin-treated mice (+ P < 0.05, ++ P < 0.01). WTH, wild-type hypoxic; A2AR−/−H, A2AR−/− hypoxic; s, saline-treated
