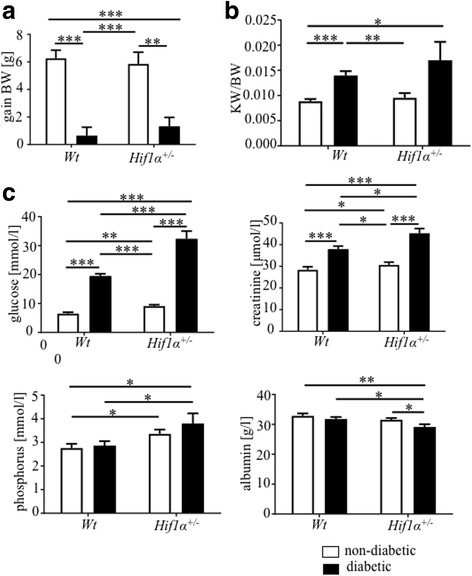
Fig. 1.

Physiological and biochemical parameters. a Body weight gain after 6 weeks from the induction of diabetes. b Changes in kidney/body weight ratio (KW/BW) after 6 weeks of diabetes exposure. The values represent means ± SEM (non-diabetic Wt (n = 9), diabetic Wt (n = 11), non-diabetic Hif1α +/− (n = 6) and diabetic Hif1α +/− (n = 12)). Two-way ANOVA showed significant effect of diabetes in the body weight gain (P < 0.0001) and in the KW/BW (P = 0.0005). c The levels of glucose, creatinine, phosphorus, and albumin in the blood serum of Wt and Hif1α +/− mice after 6 h fasting and collected at the end of experiment (6 weeks from the induction of diabetes). The values represent means ± SEM (n = 8 mice in each group). Statistical significance assessed by two-way ANOVA: genotype effect (creatinine, P < 0.001; phosphorus, P = 0.0037; albumin, P = 0.027); diabetes effect (creatinine, P < 0.0001; albumin, P = 0.027); and interaction between genotype and diabetes: glucose P < 0.0001. *Significant differences by post hoc pairwise comparison tests, *P < 0.05, **P < 0.01, ***P < 0.001
