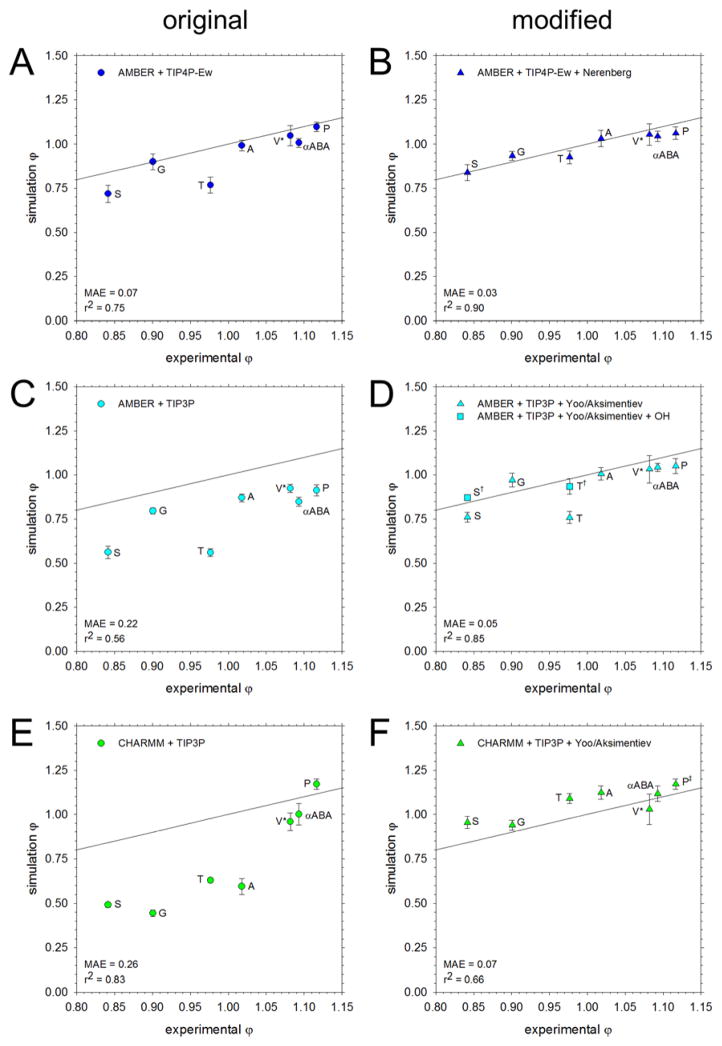
Figure 1.
Comparison of osmotic coefficients of the amino acids from simulation with experiment. All simulations were run at 2 M except for Val, which was run at 1 M (V*). The black line represents perfect correspondence between simulation and experiment; the mean average error (MAE) from experiment and the r2 value for the linear regression are noted in the bottom left corner. A. Results obtained using the AMBER force field solvated with the TIP4P-Ew water model. B. Same as A, but using the Nerenberg group’s modifications to solute-solute60 and solute-water59 interactions C. Same as A, but using the TIP3P water model. D. Same as C, but with amino N and carboxylate O interactions adjusted according to the Aksimentiev group.7 The data for Ser and Thr with additional adjustments to the OH:OH, OH:N, and OH:O interactions are shown as squares (S†, T†). E. Results obtained using the CHARMM force field with the TIP3P water model. F. Same as E, but with interactions between amino N and carboxylate O adjusted according to the Aksimentiev group.7 Modifications were not applied for Pro (P‡, see text).

