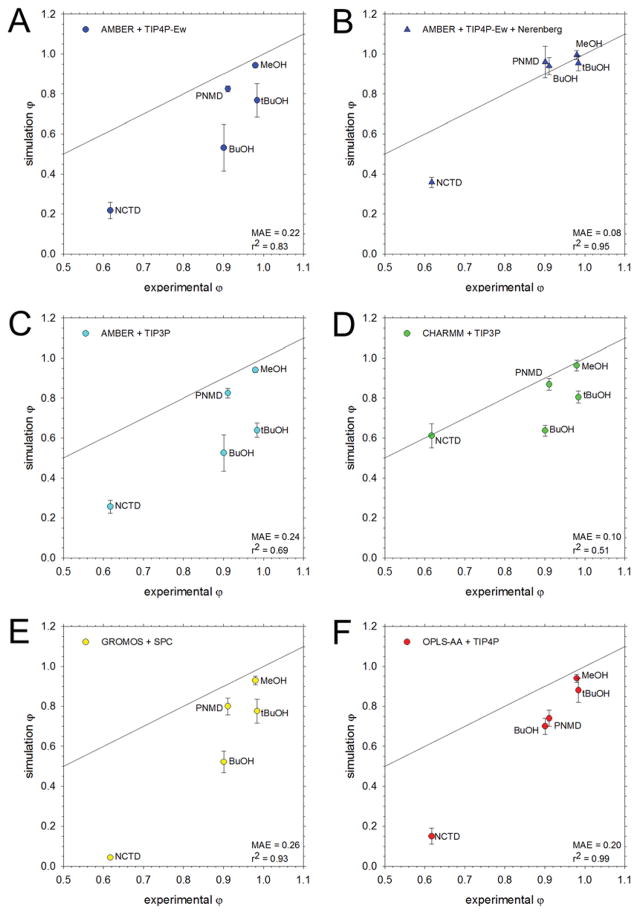
Figure 5.
Comparison of osmotic coefficients of five small molecules from simulation with experiment. The black line represents perfect correspondence with experiment; the mean average error (MAE) from experiment and the r2 value for the linear regression are noted in the bottom right corner. A. Results obtained using the AMBER force field with the TIP4P-Ew water model. B. Same as A, but using the Nerenberg group’s LJ parameters C. Same as A but with TIP3P water. D. Same as A but using the CHARMM force field with the TIP3P water model E. Same as A but using the GROMOS force field with the SPC water model F. Same as A but using the OPLS-AA force field with the TIP4P water model.

