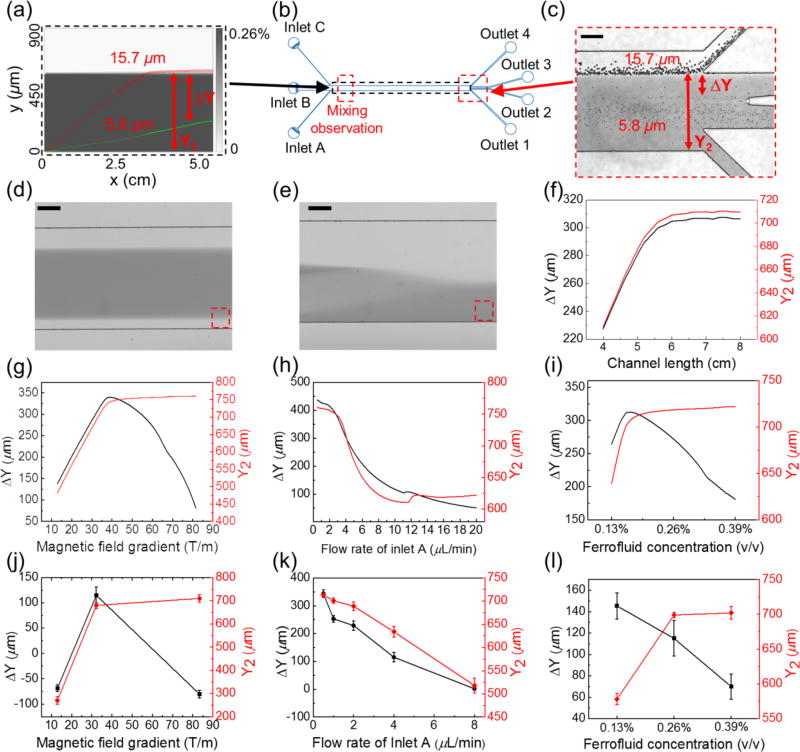
Fig. 4.
Device optimization via simulations and calibrations. (a) Simulated concentration profile of ferrofluids and the cells’ trajectories across ferrofluids and the buffer stream. The ferrofluid concentration is represented by gray scale. The trajectories of a cancer cell with 15.7 µm diameter are indicated by red circles, and trajectories of a red blood cell with 5.8 µm diameter are indicated by green circles. (b) Schematic of the microchannel with various simulation and observation windows. (c) A representative image of microparticle separation observed in the window from (b). Representative images of magnetic convective mixing (without microparticles) from the observation window in (b) with the magnet (d) and without the magnet (e). The observation window is 6.7 mm away from the entrance of the main channel. The gray scale intensity profile in the red dashed boxes of (d) and (e) can be found in Supplementary Information (ESI, Fig. S3†). The flow rate of inlet A is fixed at 4 µL/min, ferrofluid concentration is fixed at 0.26%, and magnetic field gradient is fixed at 32.2 T/m for (a)-(f). Numerical simulation of separation distance ΔY and deflection distance Y2 at the end of the channel with parameters including: (f) channel length, (g) magnetic field gradient, (h) flow rate of inlet A, and (i) ferrofluid concentration. Experimental calibration of these parameters for separation distance ΔY and deflection distance Y2 using microparticles: (j) ΔY and Y2 as a function of magnetic field gradient, (k) ΔY and Y2 as a function of flow rate of inlet A, (l) ΔY and Y2 as a function of ferrofluid concentration. The flow rate of inlet A is fixed at 4 µL/min and ferrofluid concentration is fixed at 0.26% (v/v) for (g) and (j). Magnetic field gradient is fixed at 32.2 T/m and ferrofluid concentration is fixed as 0.26% (v/v) for (h) and (k). Magnetic gradient is fixed at 32.2 T/m and the flow rate of inlet A is fixed at 4 µL/min for (i) and (l). Scale bars: 200 µm.

