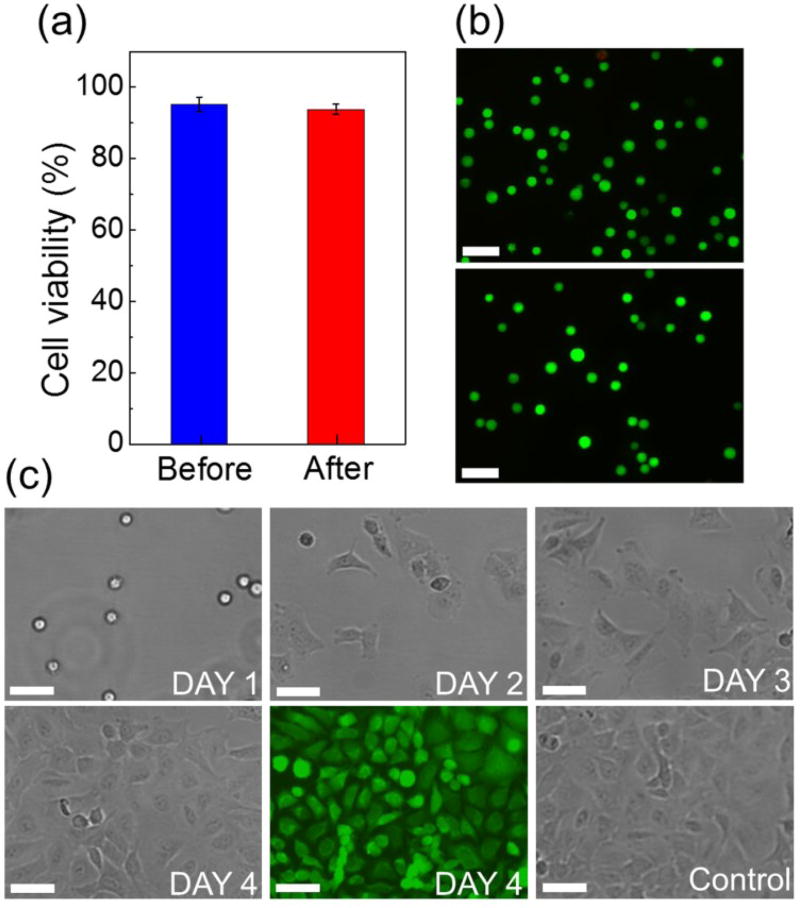
Fig. 6.
(a) Short-term cell viability comparison between before vs. after separation groups. No significant difference was found between the two. (b) Representative images of Live/Dead staining of the before (top) and after separation (bottom) groups. Calcein-AM (green) and PI (red) channels were merged in these images. Scale bars: 100 µm. (c) Bright field images of cultured A549 cells collected after separation from day 1 to day 4. A Live/Dead staining of the cultured cells on day 4 showed excellent viability. A control group of cell culture was used for comparison. No significant difference was found in cell proliferation between cells in the control group and cells collected after device separation. Scale bars: 50 µm.

