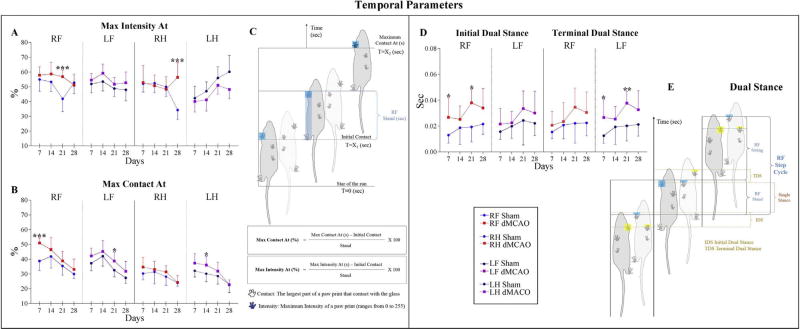
Fig. 4. Effect of dMCAO on Temporal parameters.
Graphs represent Temporal parameters displaying significant differences between dMCAO and Sham animal groups. Parameters are represented for each paw separately. For dMCAO group: RF: Right Front (red line), LF: Left Front (purple line), RH: Right Hind (red dashed line), and LH: Left Hind (purple dashed line). For Sham animals: RF: Right Front (blue line), LF: Left Front (black line), RH: Right Hind (blue dashed line), and LH: Left Hind (black dashed line). Deficits were detected in different paws, but preferentially in the right front (RF) paw affected by left dMCAO lesion, and its contralateral left front (LF) paw. Max Intensity At (A) and Max Contact At (B) parameters display the time (from start of the run) when a Paw makes maximum intensity contact with the glass plate. C) Schematic representation of the Max Intensity At and Max Contact At parameters. D) Initial and Terminal Dual Stance parameters represent the duration of simultaneous ground contact with two paws. E) Schematic illustration of the Initial and Terminal Dual Stance parameters. Values are represented as mean ± SD. Parameters were analyzed using a linear mixed-effects (LME) model, * p≤ 0.05, ** p≤ 0.01, *** p ≤ 0.001. P-values were adjusted by Benjamini Hochberg (BH) correction.

