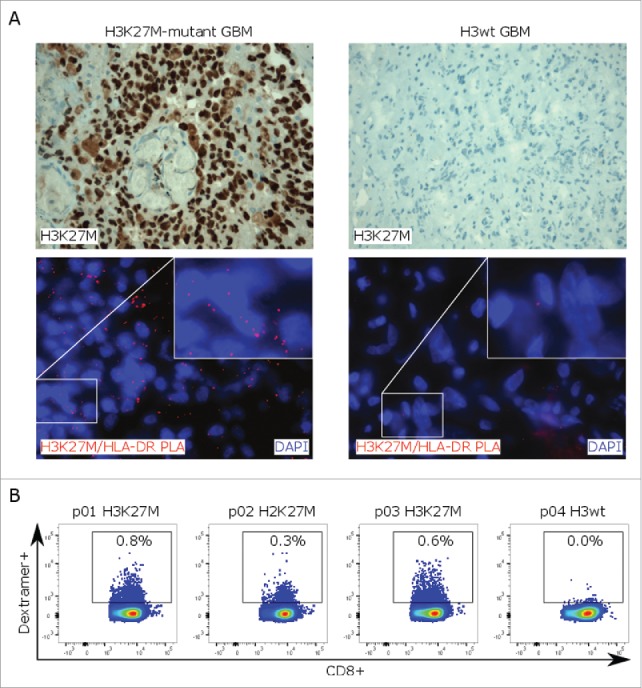
Figure 4.

H3K27M-specific T-cell responses in glioma patients. (A)H3K27M staining (upper row) and in situ proximity ligation assay (PLA, lower row) with H3K27M and HLA-DR antibodies (red signal) on H3K27M-mutant or H3 wild type glioma tissue. Cell nuclei are visualized with DAPI (blue). (B) Detection of mutation-specific CD8+ T cells in PBMC samples of glioma patients using a H3K27M p26–35-specific HLA-A*0201 dextramer. PBMCs were analyzed after ex vivo expansion in presence of H3K27M p26–35 and hIL-2 for 9 d. Individual dot plots are shown.
