
Figure 1.
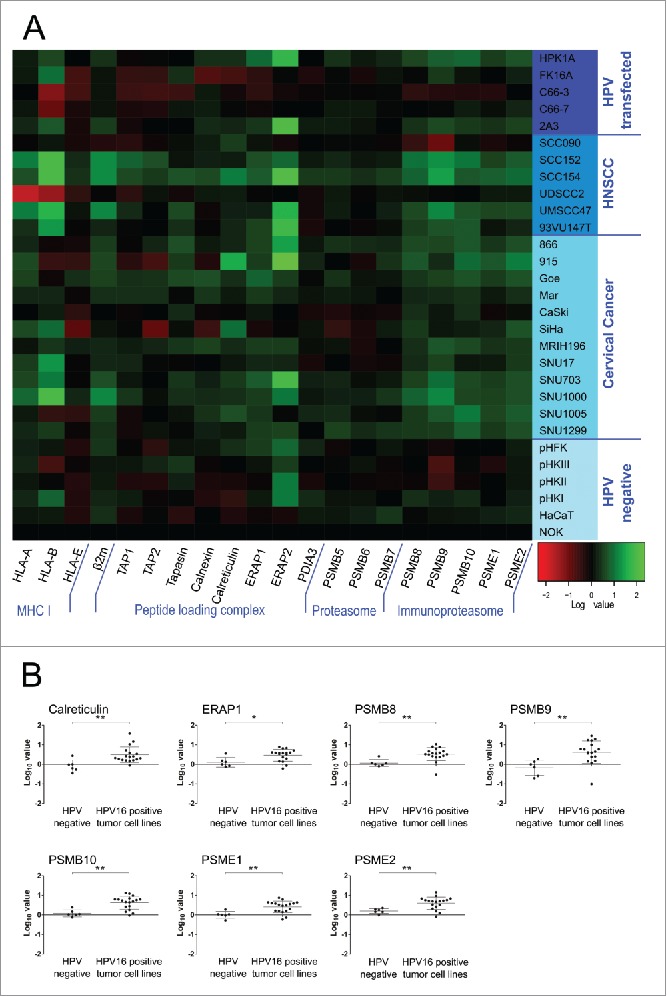
(A) Constitutive expression of the APM in keratinocyte cell lines on the mRNA level. Total RNA was purified from cells, reverse transcribed to cDNA and analyzed for APM component expression by qRT-PCR. PCR reactions were run in triplicates. The geometric mean of at least three of the following genes was used as internal reference: GAPDH, PGK1, PPIA and IPO8. Gene expression was calibrated to the NOK cell line. All quantitative qRT-PCR data were processed by LinRegPCR and data management was done by qbasePLUS 2. Log10 data were plotted as a heatmap using R. Expression of 20 APM components is shown. Each column represents a single gene and each row represents one cell line. Increased expression is shown in green and decreased expression is shown in red (see scale bar in the bottom right corner). HNSCC = head and neck squamous cell carcinoma. (B) APM components that showed a significantly elevated expression in HPV16-positive tumor cell lines compared to HPV-negative cells. Log10 expression data is plotted for each cell line, mean ± SD of each group is shown. *p ≤ 0.05, **p ≤ 0.01 (unpaired t-test).