
Figure 1.
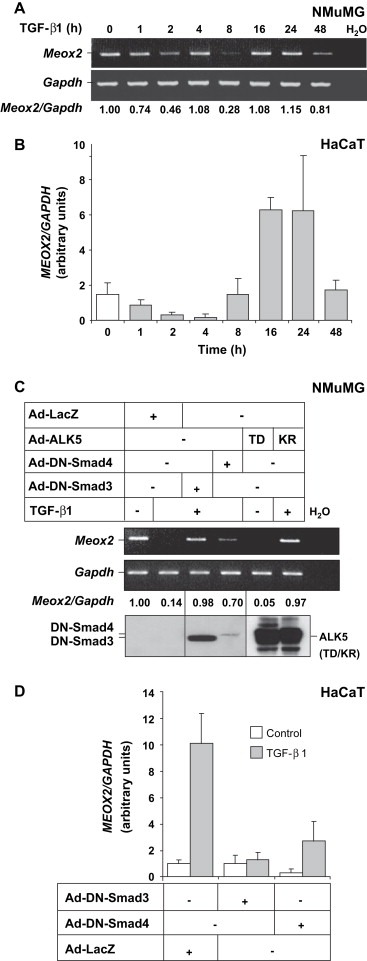
Expression profile of Meox2 in response to TGF‐β1. (A) Semi‐quantitative RT‐PCR analysis of Meox2 and Gapdh from NMuMG cells during a time course experiment with 5ng/ml TGF‐β1. Normalized Meox2 mRNA expression values are listed. (B) Quantitative real time RT‐PCR of MEOX2 and GAPDH from HaCaT cells stimulated with 5ng/ml TGF‐β1 for the indicated time periods. (C) Semi‐quantitative RT‐PCR analysis of Meox2 and Gapdh mRNA expression in NMuMG cells infected with adenoviruses (MOI 100) expressing the indicated proteins and stimulated with 5ng/ml TGF‐β1 for 2h. Normalized Meox2 mRNA expression values are listed. Immunoblots with anti‐Flag or anti‐HA antibodies of duplicate cell cultures treated under identical conditions demonstrate expression of the infected proteins (Smads, anti‐FLAG and ALK5, anti‐HA). (D) Quantitative real time RT‐PCR of MEOX2 and GAPDH from HaCaT cells infected with adenoviruses (MOI 100) expressing the indicated proteins and stimulated with 5ng/ml TGF‐β1 for 16h.