Figure 3.

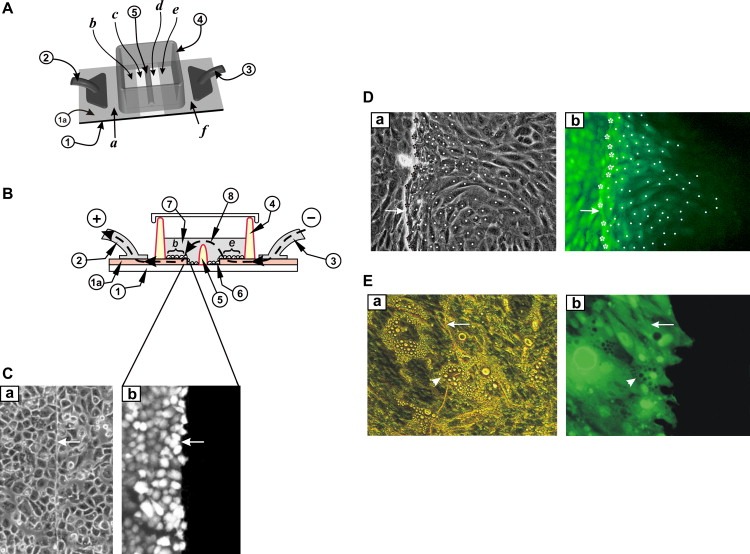
Electroporation on two co‐planar ITO electrodes, with a barrier separating the two areas. (A) Top view. Cells were grown on an ITO‐coated slide from which the coating was removed in a strip as shown. The two conductive sides (a, f), serving as electrodes, were connected to the positive and negative poles of the pulse generator (2) and (3). A non‐conductive barrier (5) divides the strip of bare glass in half and separates the chamber into two sections. (B) Side view. The slide with the cells growing on the ITO coated and the bare glass regions is shown. When electroporation buffer is added to the chamber to a level above the height of the barrier (5) then an electrical path between the electrodes (e and b) is formed. Note that the ITO layer (1a) is shown with dramatically exaggerated thickness for clarity, although its actual thickness is much less than the thickness of the cells. (C) A549 cells were plated on the slide in (A) above and electroporated in the presence of Lucifer yellow as in Fig. 2 above. After washing the unincorporated dye, cells from the same field were photographed under fluorescence (b) or phase contrast (a) illumination. Note the absence of fluorescence in cells growing on the non‐conductive part of the slide. Arrows point to the transition line between conductive and non‐conductive areas. (D) 3T3 L1 preadipocytes were plated in the window shown in (A) above and electroporated in the presence of Lucifer yellow. After washing the unincorporated dye, cells from the same field were photographed under fluorescence (b) or phase‐contrast (a) illumination. Note the gradient of fluorescence, indicating extensive dye transfer through gap junctions (Raptis et al., 2006; Tomai et al., 1999). To quantitate gap junctional communication, electroporated cells growing at the border with the non‐conductive zone (stars), and fluorescing cells growing on the non‐conductive side of the slide, into which the dye had transferred through gap junctions (dots) were identified. The number of cells into which the dye has transferred per electroporated border cell can be calculated by dividing the total number of fluorescing cells on the non‐conductive side by the number of cells growing at the border with the conductive coating. Arrows on the conductive side point to the transition line between conductive and non‐conductive areas. Magnification: 200×. (E) 3T3L1 preadipocytes were plated in the window shown in (A) above and induced to differentiate by the addition of IBMX, insulin and dexamethasone at confluence (see Section 3). Ten days later, terminally differentiated adipocytes were electroporated in the presence of Lucifer yellow. Note the absence of dye transfer through gap junctions. Arrows point to the transition line between conductive and non‐conductive areas. Arrowheads point to a terminally differentiated adipocyte growing on the transition line between conductive and non‐conductive areas. Magnification: 200×.
