Figure 2.

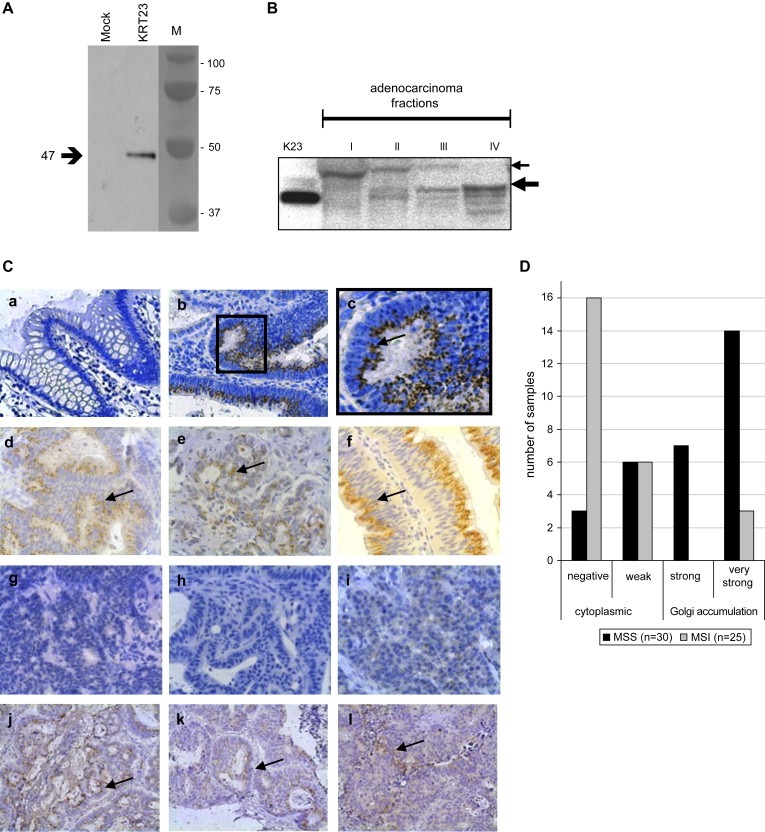
Characterization and cellular localization of the K23 protein. (A) Incubation of 5μg of protein extracts from COS7 cells transfected with pCR3.1 (mock) or pCR 3.1:KRT23 (KRT23) with a 1:1000 dilution of the rabbit anti‐K23 antibody identified a single band of approximately 47kDa. (B) Subcellular proteomic fractions from a colon adenocarcinoma were incubated with a 1:500 dilution of the anti‐K23 antibody: (I) cytosolic fraction; (II) membrane/organelle protein fraction; (III) nucleic protein fraction including cellular membranes attached to the nucleus; and (IV) cytoskeletal fraction. (Ctrl) K23. Two main distinct bands of approximately 47kDa and 55kDa are detectable. The 55kDa band was always detected in the cytosolic fraction but never in the cytoskeletal fraction, while the 47kDa band was always strongest in the cytoskeletal fraction but never visible in the cytosolic fraction. (C) Immunohistochemical analyses were performed applying the rabbit anti‐K23 antibody in a 1:600 dilution to FFPE specimens of normal colon mucosas, colon adenocarcinomas and metastases (200× magnification). (a–c) K23 is strongly upregulated in tumor cells of colon adenocarcinomas compared to normal mucosa. (a) Normal mucosa from the resection edge; (b) Dukes C grade 2 adenocarcinoma from the proximal colon; and (c) 400× magnification of (b) showing K23 accumulation at a single site adjacent to the nucleus, probably the GA. (d–i) Analysis of a subset of 55 colon adenocarcinomas previously analyzed on U133A2.0 arrays, comprising 30 tumors with MSS and 25 with MSI status. (d–f) K23 was highly expressed in MSS tumors showing supranuclear accumulation. (g–i) MSI tumors show no or very weak K23 expression in the cytoplasm, probably in cytoplasmic vesicles. (j–l) The primary adenocarcinoma (j), a lymph node metastasis (k) and a liver metastasis (l) obtained successively from the same patient, show strong accumulation of K23 near the nucleus. (D) Scoring results from immunohistochemical analysis of K23 expression in 55 colon adenocarcinomas previously analyzed on microarrays (U133A2.0). The staining intensity of K23 in 30 tumors with MSS status (black) was compared to 25 tumors with MSI status (grey). Strong to very strong K23 accumulation expression accompanied by accumulation of the protein in the Golgi was seen in the majority of MSS tumors.
