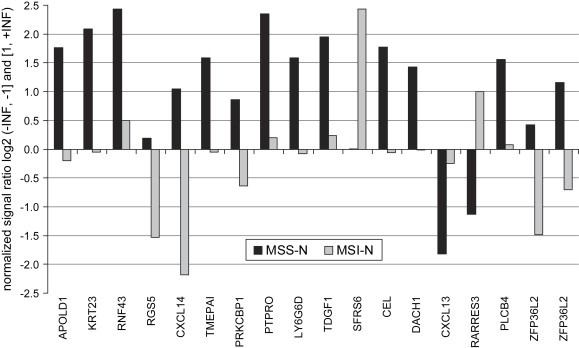
Figure 5.

Genes characterizing subgroups of colon adenocarcinomas. Top 17 genes (18 probe sets) differentially expressed in “MSS tumors with high K23” compared to “MSI tumors with low/no Keratin 23” were accessed by immunohistochemistry followed by supervised clustering of transcript profiling data. Ratios are based on median values and are given as normalized ratio log2 (−INF, −1] and [1, +INF).
