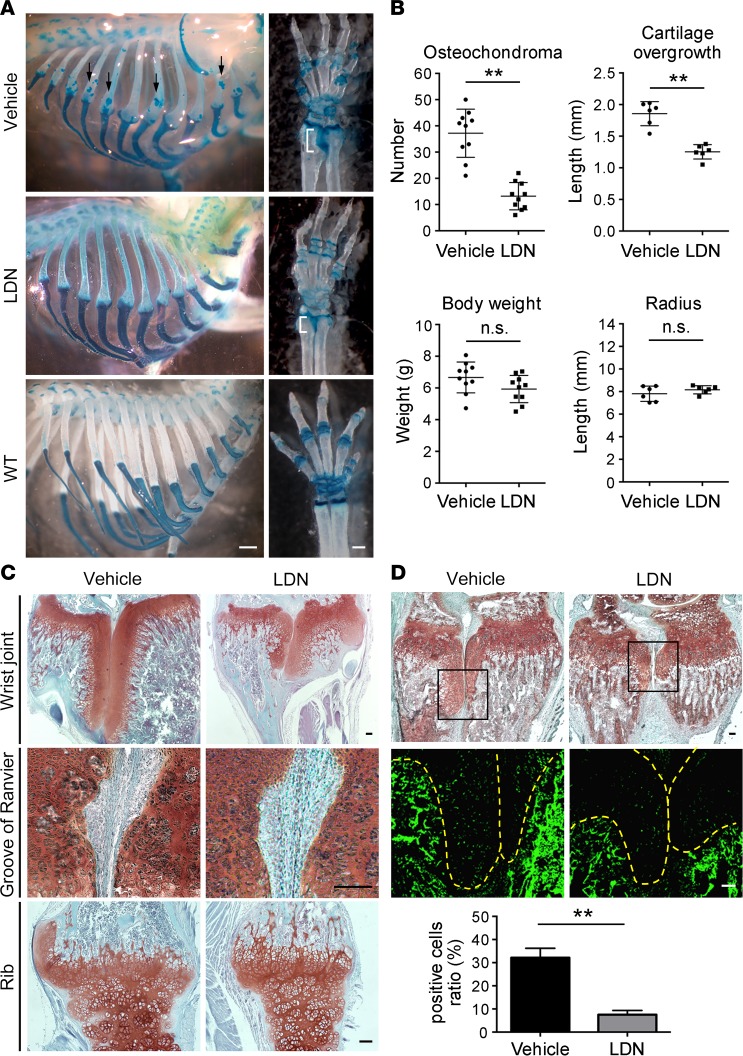
Figure 5. Pharmacological inhibition of BMP with LDN-193189 suppresses osteochondromagenesis in Col2a1-Ext1CKO mice.
Col2a1-Ext1CKO mice were treated with LDN-193189 as described in Methods. (A) Whole-mount skeletal preparations of the rib cage and the forelimb of LDN-193189- and vehicle-treated mice. LDN-193189 suppresses osteochondroma formation in rib bones (arrows) and cartilage overgrowth in the wrist joint area (white brackets). Swelling of the chondro-osseous junction are also mitigated. Data shown are representative images of 10 animals per genotype. Specimens of WT control (Ext1flox/flox; WT) mice are shown for comparison. (B) Quantitative assessment of the effect of LDN-193189. Treatment with LDN-193189 reduced the number of osteochondromas in rib bones and the length of cartilage overgrowth between the radius and ulna. Body weight and the longitudinal growth of the radius were not affected. Means ± SD (n = 10 for the number of osteochondroma and body weight; n = 6 for the size of cartilage overgrowth and the length of the radius) were shown as horizontal bars. **P < 0.01 by Student’s t test. (C) Safranin O–stained sections of the wrist joint area (top), the groove of Ranvier (middle), and the chondro-osseous junction of a rib bone (bottom). In LDN-193189–treated animals, the size of cartilage overgrowth between the radius and ulna is reduced (top panels) and the disorganization of perichondrium/cartilage boundaries in the groove of Ranvier and in the rib bone is reduced (middle and bottom panels). Representative images were obtained from at least 3 mice per genotype. (D) Effects of LDN-193189 on BMP signaling in situ. pSmad1/5/8 immunoreactivity in the overgrown cartilage (indicated by broken lines) is reduced in LDN-193189–treated animals compared with vehicle-treated animals. The bar graph shows the ratio of the number of pSmad1/5/8-immunoreactive cells relative to the total number of cells determined by TO-PRO-3 staining. Means ± SD (n = 8) are shown as horizontal bars. **P < 0.01 by Student’s t test. The representative images were shown. Scale bars: 1 mm (A); 0.1 mm (C, D).

