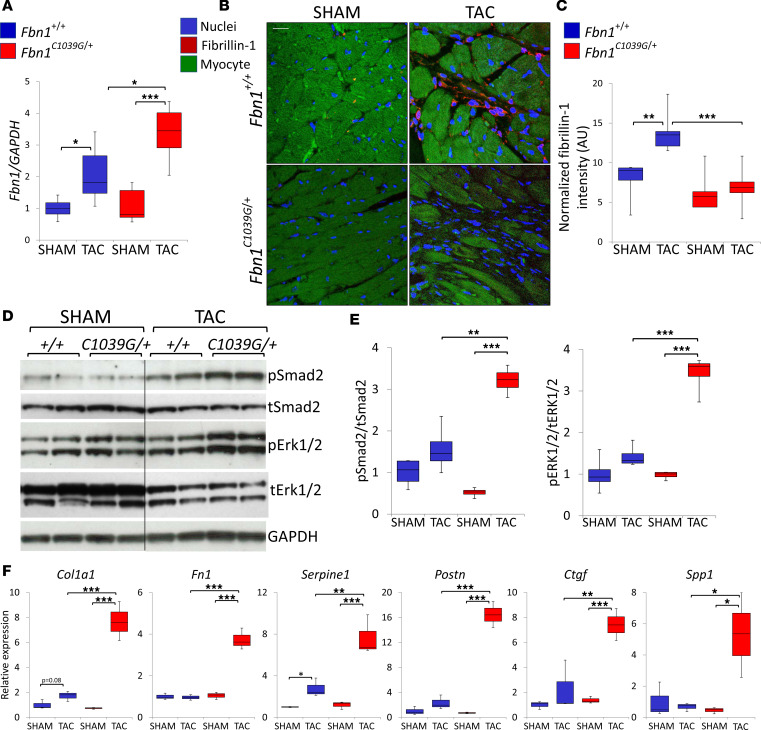
Figure 2. Fibrillin-1 protein fails to deposit in myocardium in load-induced heart failure in Fbn1C1039G/+ mice.
(A) mRNA expression of Fbn1 normalized to Gapdh and then to Fbn1+/+:sham data, assessed by real-time RT-PCR. n ≥ 4 per group. (B) Representative images of immunofluorescent fibrillin-1 staining (red) of heart sections from Fbn1+/+ and Fbn1C1039G/+ mice subjected to 4 weeks of TAC. Red, fibrillin-1 (interstitial space); blue, DAPI (nuclei); green, lipofuscin (myocytes). Scale bar: 20 μm. (C) Quantitative representation of fibrillin-1 normalized to unit area. n = 4–7 per group. (D and E) Representative Western blot and summary quantification for phosphorylated/total (p/t) Smad2 and ERK1/2 using left ventricular tissue lysates. Lanes were run on the same gel but were noncontiguous. n ≥ 4 per group. (F) mRNA expression of TGF-β targets, normalized to 18S and then to Fbn1+/+ data, assessed by real-time RT-PCR from left ventricular tissue. Col1a1, collagen type 1 a1; Fn1, fibronectin; Serpine1, plasminogen activator inhibitor, type 1; Postn, periostin; Ctgf, connective tissue growth factor; Spp1, osteopontin. n = 3–6 per group. *P < 0.05, **P < 0.01, ***P < 0.001, 1-way ANOVA, Tukey’s correction. In box-and-whisker plots, the lower and upper margins of each box define the 25th and 75th percentiles, respectively; the internal line defines the median, and the whiskers define the range. Values outside 1.5 times the interquartile distance are shown.

