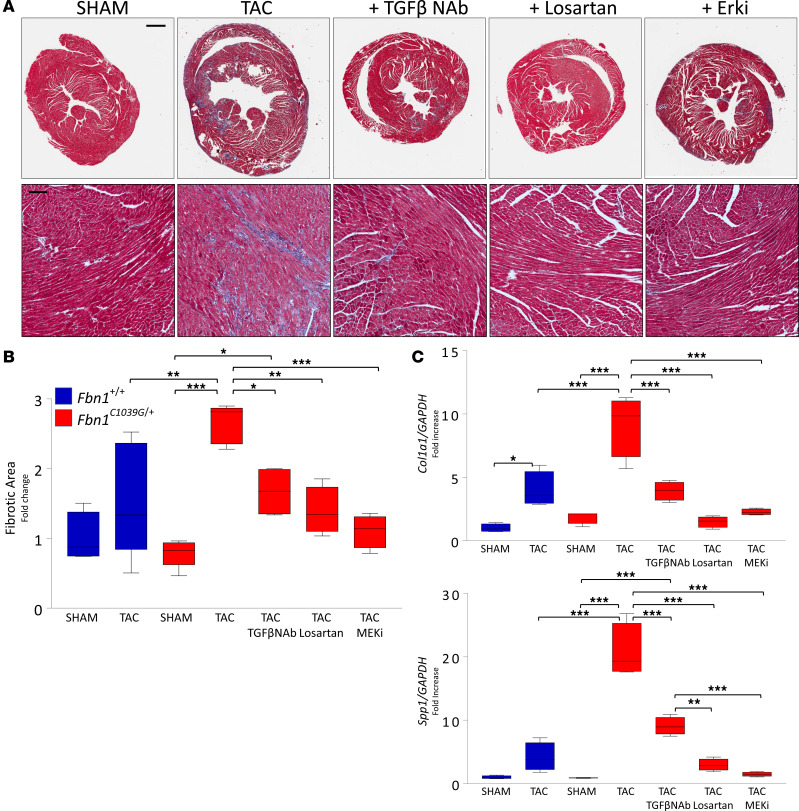
Figure 5. Functional improvement of mechanically loaded Fbn1C1039G/+ hearts correlates with reduced fibrosis.
(A) Representative Masson’s trichrome–stained heart sections of Fbn1C1039G/+ sham vs. TAC groups, with and without treatment, showing fibrosis stained in blue. Scale bars: 750 μm (top); 100 μm (bottom). (B) Quantification of fibrosis, quantified by total number of blue pixels normalized to whole tissue area and then to Fbn1+/+:sham data. n = 4–7 per group. (C) mRNA expression of TGF-β–responsive fibrogenic genes, normalized to Gapdh and then to Fbn1+/+:sham data, assessed by real-time RT-PCR. Col1a1, collagen type 1 a1; Spp1, osteopontin. n = 4–6 per group. *P < 0.05, **P < 0.01, ***P < 0.001, 1-way ANOVA, Tukey’s correction. In box-and-whisker plots, the lower and upper margins of each box define the 25th and 75th percentiles, respectively; the internal line defines the median, and the whiskers define the range. Values outside 1.5 times the interquartile distance are shown.

