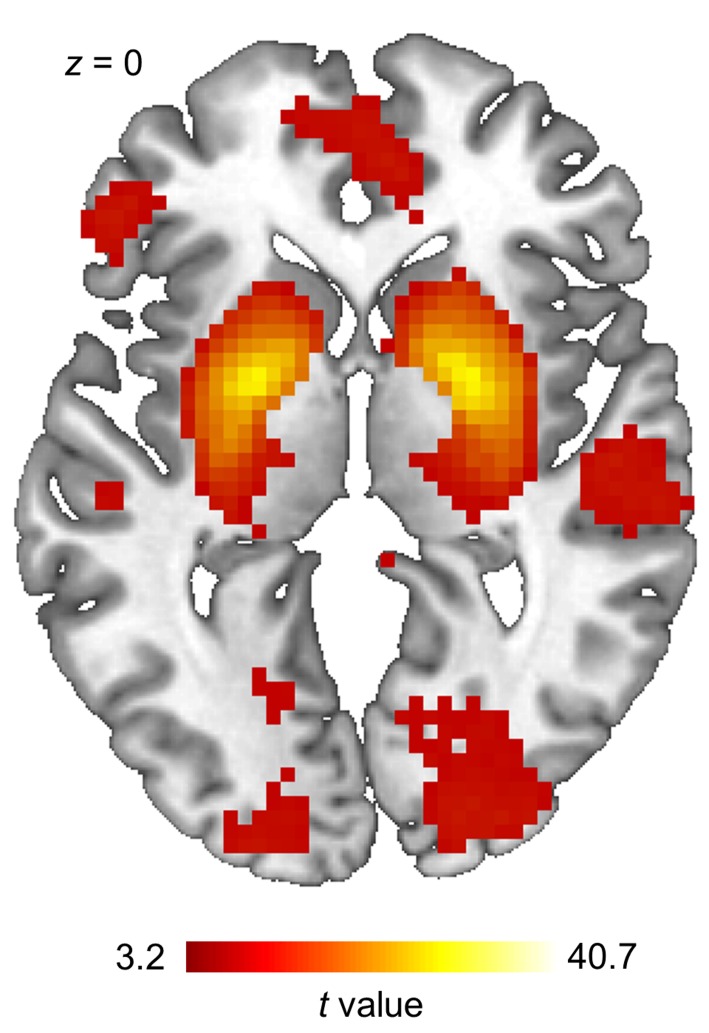
Figure 8. Reward component derived from the group independent component analysis.
The brain reward network obtained using a spatial group independent component analysis and subsequent spatial correlation with an a priori defined structural mask of relevant brain reward regions (correlation with the template mask, r = 0.341). The obtained component was included in a random-effect analysis using a 1-sample t test, with age and BMI as covariates of no interest (n = 23). The statistical map was thresholded at a cluster-defining threshold of P < 0.001 uncorrected (cluster size k > 10). We observed significant clusters of activation at a family-wise error corrected cluster level threshold of P < 0.05 in the bilateral striatum, posterior cingulate cortex, inferior parietal cortex, lingual gyrus, inferior and superior frontal gyrus, precuneus, medial and lateral orbitofrontal cortex, occipital cortex, and the postcentral gyrus. We observed no results when comparing component activity between metabolic states using a 2-sample t test with age and BMI as covariates of no interest.

