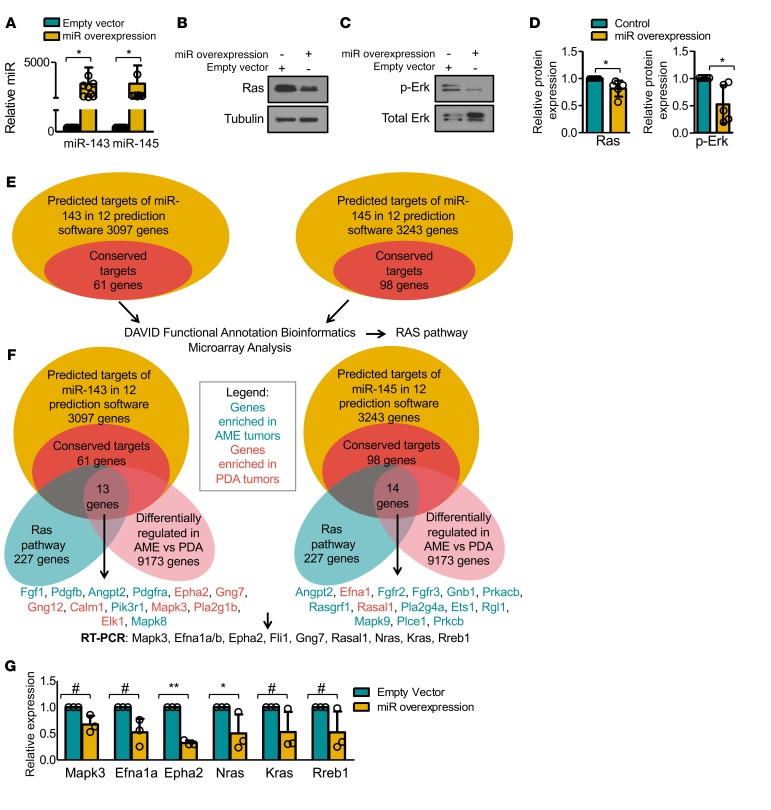
Figure 7. miR-143/145 overexpression targets the Ras pathway.
(A) Quantitative RT-PCR analysis of miR-143 and miR-145 levels following lentiviral transduction of miR-143 and miR-145. n = 9. Student’s t test, P < 0.05. Bars represent mean ± SD. Circles represent individual data points. (B) Representative Western blot analysis for Ras (K-Ras plus N-Ras) following miR-143/145 overexpression. n = 5 (see Figure 7D). (C) Representative Western blot analysis for phospho-Erk following miR-143/145 overexpression. n = 5 (see Figure 7D). (D) miR-143/145 overexpression leads to reduced Ras expression (n = 5, Student’s t test, P = 0.0470), and phospho-Erk levels (n = 5, Student’s t test, P = 0.0387). Bars represent mean ± SD. Circles represent individual data points. (E) Workflow used to identify potential targets and pathways regulated by miR-143/145. The conserved 61 miR-143 and 98 miR-145 genes are listed in Supplemental Table 1. (F) Venn diagram of predicted targets of miR-143 (13 genes) and miR-145 (14 genes), which are conserved, on the Ras pathway and differentially regulated between pten-deficient adenomyoepithelioma (AME) and poorly differentiated adenocarcinoma (PDA) tumors. Genes enriched in AMEs are highlighted in green; those enriched in PDAs in red. (G) Quantitative RT-PCR analysis of predicted miR-143/145 targets Mapk3, Efna1a, Epha2, Nras, Kras, and Rreb1 following miR-143/145 overexpression. ANOVA (P < 0.0001) and Bonferroni post-hoc test (#P < 0.09, *P < 0.05, **P < 0.001). n = 3. Bars represent mean ± SD. Circles represent individual data points.

