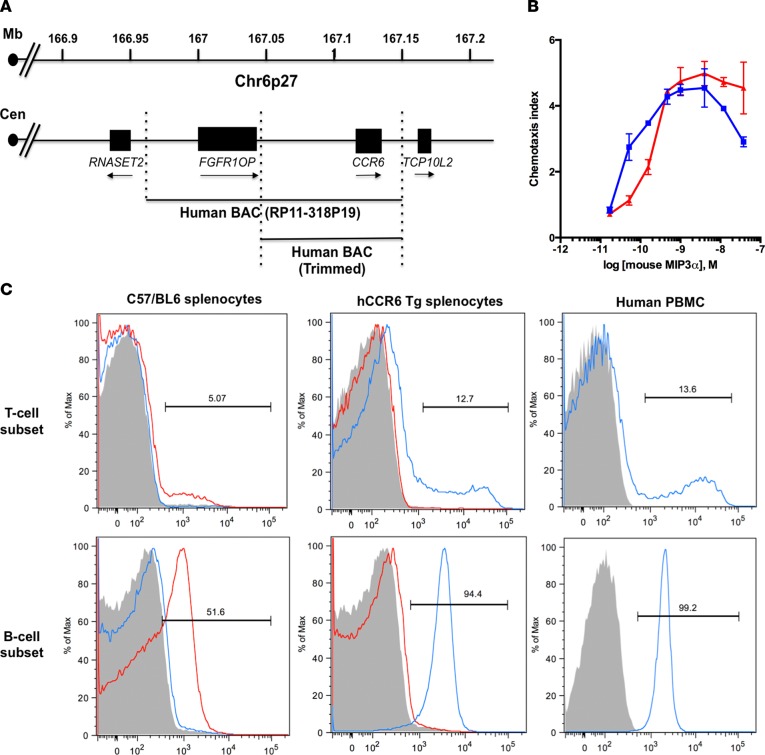
Figure 2. Characterization of hCCR6-Tg/mCCR6–/– mice.
(A) hCCR6-Tg/mCCR6–/– mice were constructed using a bacterial artificial chromosome (BAC) encompassing the human CCR6 locus. (B) Purified CD3+ T cells from hCCR6-Tg/mCCR6–/– mice (blue line) or WT mice (red line) show similar chemotactic activity towards the mouse CCL20 ligand. (C) The expression of mCCR6 (clone FAB590A, red line) or hCCR6 (clone G034E3, blue line) on T cells (top panels) or B cells (bottom panels) was compared between WT (left panels), hCCR6-Tg/mCCR6–/– (middle panels), and human peripheral blood mononuclear cells (PBMCs) (right panels). The gray histograms represent the isotype controls.

