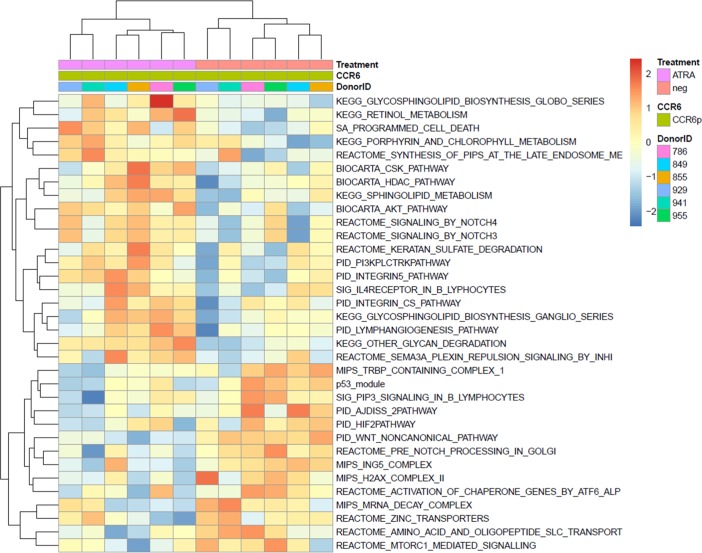
Figure 3. Canonical pathways modulated by ATRA in CCR6+ T cells.
Memory CCR6+/CCR6– T cells were sorted and stimulated as described in Figure 1. Total RNA from matched T cell subsets of n = 6 different HIV-uninfected donors was used for genome-wide transcriptional profiling, as described in Figure 2. One-way ANOVA analysis identified differentially expressed genes based on P values or adjusted P values (P < 0.05) and/or fold change (FC, cutoff 1.3). The heatmap depicts the top 34 pathways upmodulated (red) and downmodulated (blue) by ATRA in CCR6+ T cells, identified using gene-set variation analysis (GSVA; P < 0.01;enrichment Z score).

