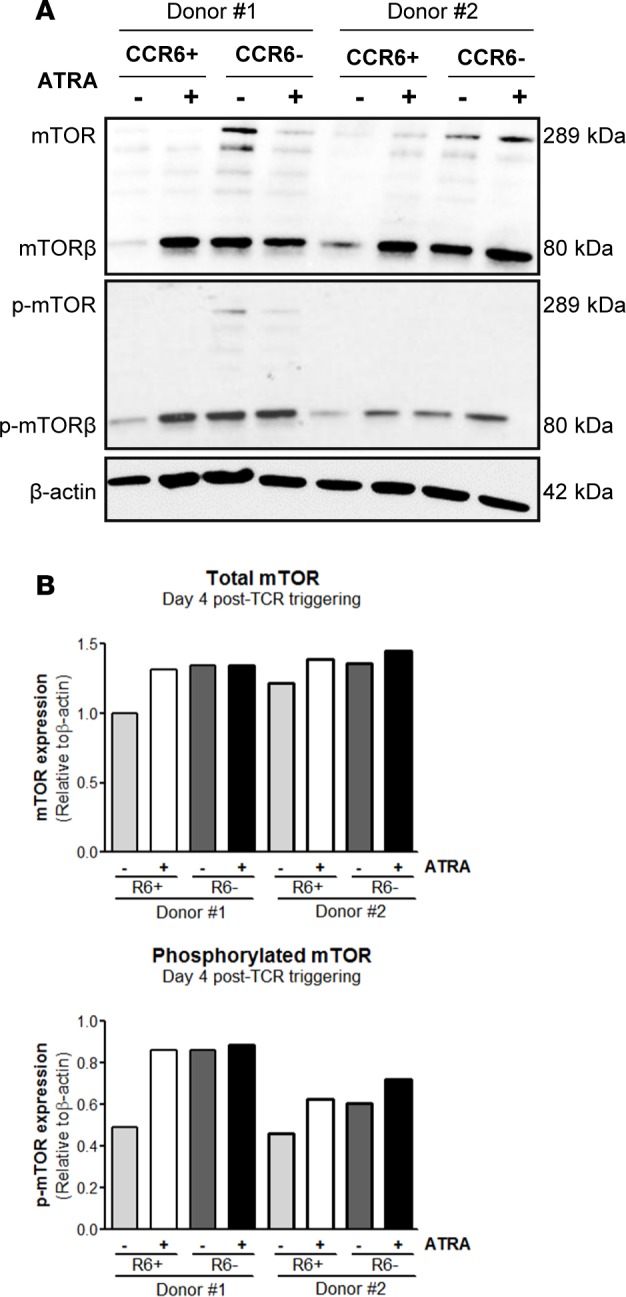
Figure 5. ATRA induces mTOR expression and phosphorylation selectively in CCR6+ T cells.

Memory CCR6+ and CCR6– T cell subsets were sorted and stimulated as described in Figure 1. (A) Cell lysates were used to visualize total and phosphorylated mTOR expression by Western blotting. (B) Levels of total and phosphorylated mTOR expression were quantified by densitometry and normalized relative to β-actin levels. Of note, the molecular weight of the predominant mTOR band was 80 kDa, corresponding to the β isoform of mTOR (1). Results obtained with cells from two different donors are shown.
