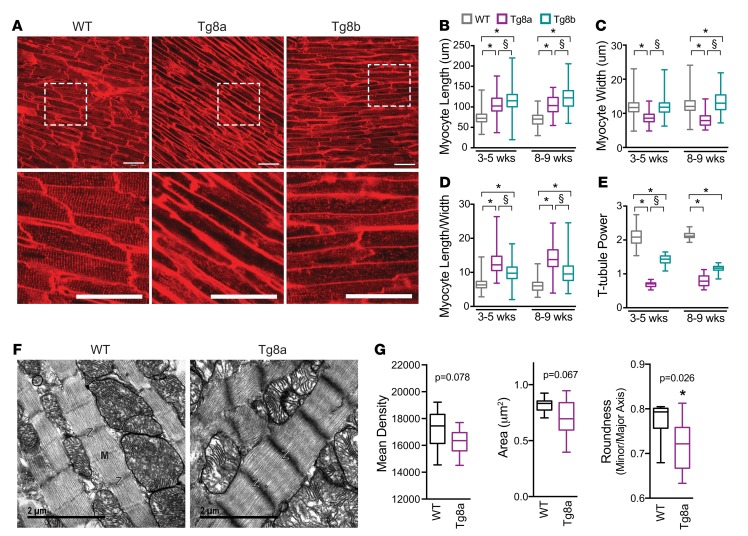
Figure 4. Structural analyses reveal that cardiomyocytes from Cdk8-transgenic mice are considerably eccentric, with abnormal T-tubules, sarcomeres, and mitochondria.(A–E) Eccentric cardiomyocytes with disorganized T-tubules constitute Cdk8-transgenic hearts.
(A) Representative confocal micrographs of left ventricular epicardia from 4-week-old WT, Tg8a, and Tg8b animals imaged with the fluorescent membrane dye FM-4-64. Images below are enlarged views of boxed areas on top row. Punctate domains of FM-4-64 staining on myocyte membrane mark T-tubular invaginations. Scale bar: 50 μm. (B–E) Summary box plots of myocyte length (B), width (C), length-width ratios (D), and T-tubular integrity analysis (E) of WT (gray), Tg8a (magenta), and Tg8b (cyan) hearts. *P < 0.001; vs. age-matched WT; §P < 0.001 vs. age-matched Tg8a, 1-way ANOVA with Tukey’s multiple comparisons test, n = 30–50 images from 3–5 hearts. The box plots depict the minimum and maximum values (whiskers), the upper and lower quartiles, and the median. The length of the box represents the interquartile range. (F) Representative electron micrographs of 3-week-old WT and Tg8a littermate ventricular tissue. Compared with WT, Tg8a sarcomeres lacked discernible M-lines (M) between adjacent Z-lines (Z). Scale bar: 2 μm. (G) Summary box plot analyses of electron micrographs from WT (black) and Tg8a (magenta) ventricles measuring mitochondrial mean density, area, and minor/major axis ration for roundness. The box plots depict the minimum and maximum values (whiskers), the upper and lower quartiles, and the median. The length of the box represents the interquartile range. Individual mitochondrial were traced and measured using ImageJ. *P < 0.05, t test, n = 3 hearts, > 1,600 mitochondria from 9–11 images.

