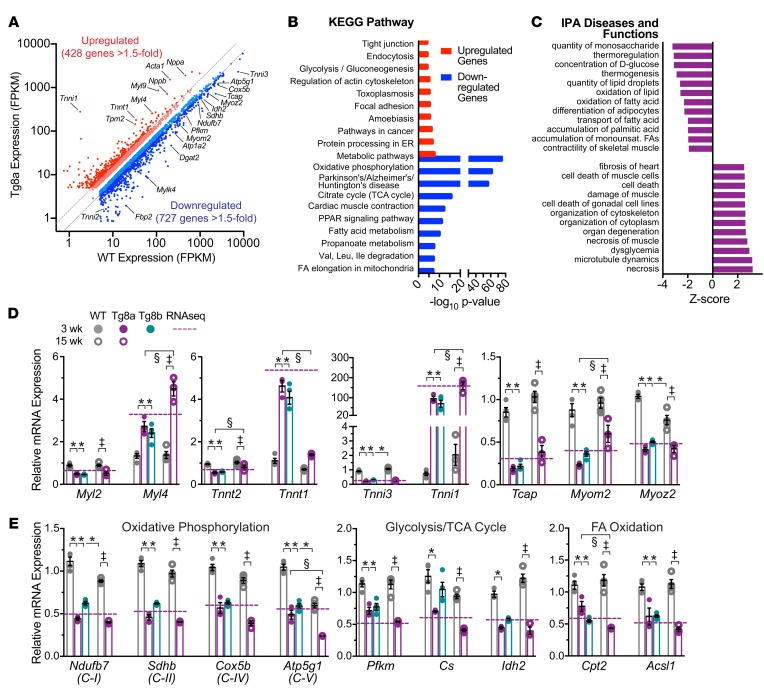
Figure 6. RNA analysis indicates that cardiac-specific Cdk8 expression promotes myofilament isoform switching and downregulation of mitochondrial-related metabolic pathways.
(A) Scatter plot of RNA sequencing (RNA-seq) expression values of significant differentially regulated ventricular RNAs (false discovery rate < 0.05) with greater than 5 fragments per kilobase per million reads (FPKM) from 3-week-old WT and Tg8a littermates (n = 5). An additional cutoff of 1.5-fold upregulated and downregulated genes is marked by dashed lines (red, upregulated >1.5-fold; light red, upregulated <1.5-fold; light blue, downregulated <1.5-fold; blue, downregulated >1.5-fold). Select myofilament and metabolic genes are designated. (B) Top 10 hits from KEGG pathway enrichment analyses of RNA-seq results. Significantly upregulated (red) and downregulated (blue) gene sets >1.5-fold change) were analyzed separately via the WebGestalt online tool. “Metabolic pathways” is the only top 10 category enriched in both sets. (C) Top predicted annotations for diseases and functions ranked by Z-score by Ingenuity Pathway Analysis (IPA) for all significant differentially expressed genes (>1.5-fold up/downregulated). (D and E) Quantitative reverse transcriptase PCR of differentially expressed sarcomeric (D) and metabolic (E) genes identified by RNA-seq analysis. Changes in expression were validated in independent 3-week-old (filled symbols) WT (gray), Tg8a (magenta), and Tg8b (cyan) ventricular samples and compared with 15-week-old (white symbols) WT and failing Tg8a hearts. *P < 0.05 vs. 3-week WT; §P < 0.05 3-week vs. 15-week Tg8a; ‡P < 0.05 15-week WT vs. 15-week Tg8a; 1-way ANOVA with Tukey’s multiple comparisons test; n = 3–4 performed in triplicate. Dashed magenta line represents the fold change (Tg8a vs. WT) from RNA-seq results.

