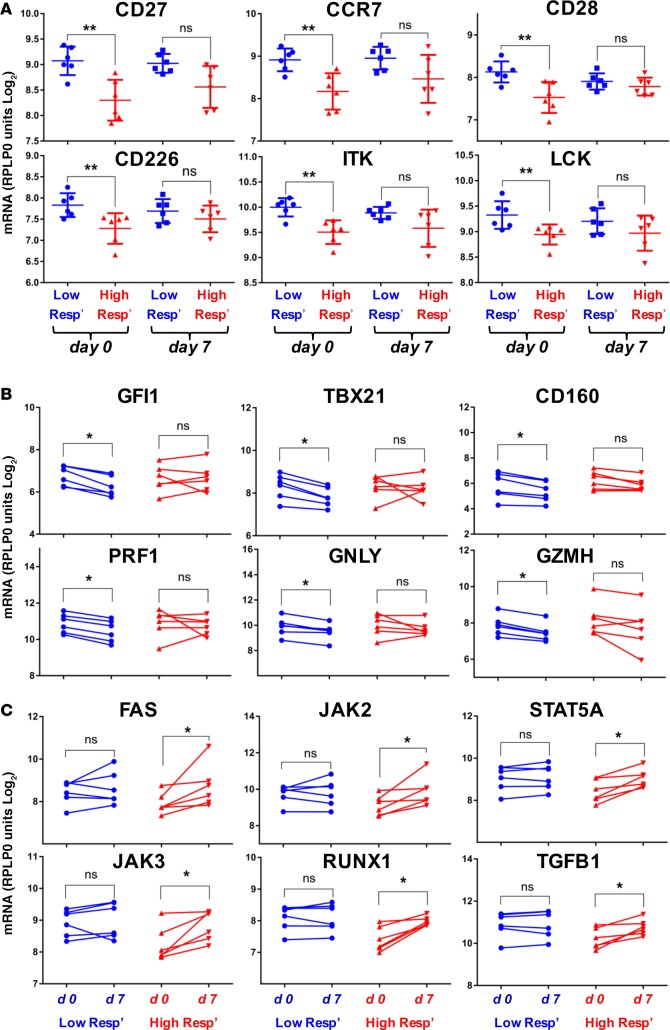
Figure 5. mRNA expression defines low- and high-miR responder groups prior to and during infection.
mRNA expression in whole blood was determined for a set of 135 genes using NanoString in 12 volunteers taken prior to (d0), and on day 7 (d7) of infection the from high- and low-miR responder groups. (A) The top 6 differentially expressed genes between the low- and high-miR responders groups by P value (Mann-Whitney test, mean and SD are indicated). Paired analysis of changes in mRNA expression for individuals between d0 and d7 of infection (Wilcoxon test), (B) the top 6 regulated genes for the low-miR responders and (C) for the high-miR responders (by P value). *P < 0.05; **P < 0.01. ns, not significant.

