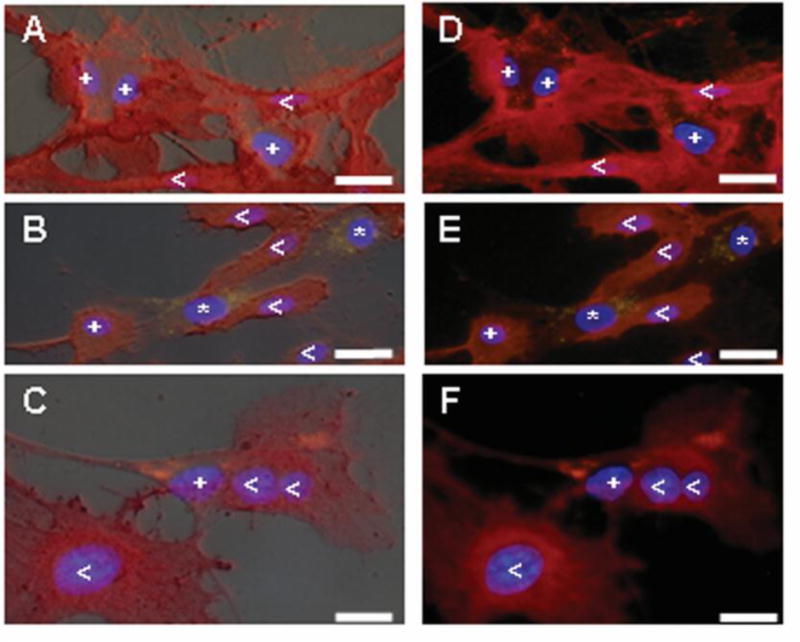
Figure 2.

DiI-labeled MSCs co-cultured with macroECs for 2 days were stained with for PECAM expression (TRITC/red). Thus, (<) PECAM-positive ECs appear dark red, (*) PECAM-negative MSCs exhibit yellow punctations, and (+) PECAM-positive MSCs appear red with orange punctations. Blue = DAPI. Images A–C are merged with the corresponding bright-field image. (Bar = 10 μm)
