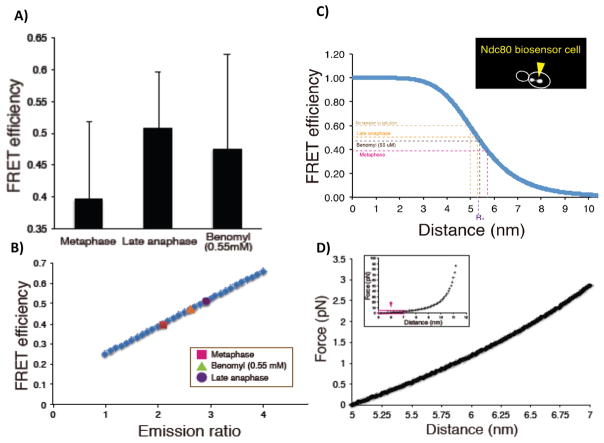
Figure 3.
Estimate mean force measured by FRET BioSensor. A: Measured values of FRET efficiency for control metaphase and late anaphase, and for cells treated with low-dose benomyl (55μM). B: FRET efficiency versus Emission Ratio shows linear dependency. C: FRET efficiency versus distance between fluorophores. Inset shows FRET in cell with the Ndc80 biosensor. The outline of the budded cell (white) and clusters of bi-oriented Ndc80 in metaphase are shown. The four dotted lines in the graph represent the position of No tension in solution (lt. brown), Late Anaphase (yellow), Benomyl 55μm (dk brown), and Metaphase (purple). D: Estimated force extension curve calculated using worm like chain (see WLC equation in text).

