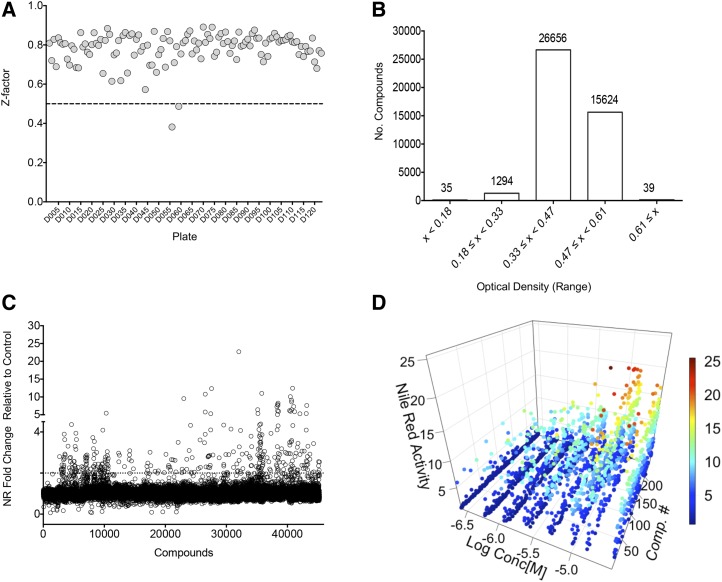
Figure 1.
Summary of results of high-throughput screening. A, Z-factor calculation for each of 124 plates totaling 43,736 compounds. The average Z′ value was 0.78 ± 0.08 with a coefficient of variation of 14.4%. B, Growth measured as OD600 in the presence of compound after 72 h. The average of the N+ control cells was 0.41 ± 0.04. C, Lipid accumulation measured as relative fluorescence after Nile Red (NR) staining of cells treated with compound relative to cells treated with vehicle (DMSO). D, Confirmation of hits and dose response. Data for 243 compounds are shown fitting the concentration-response curve (from 0.25 to 30 μm) to lipid accumulation. The scale bar represents the relative fold change of treatment compared with control (N+).

