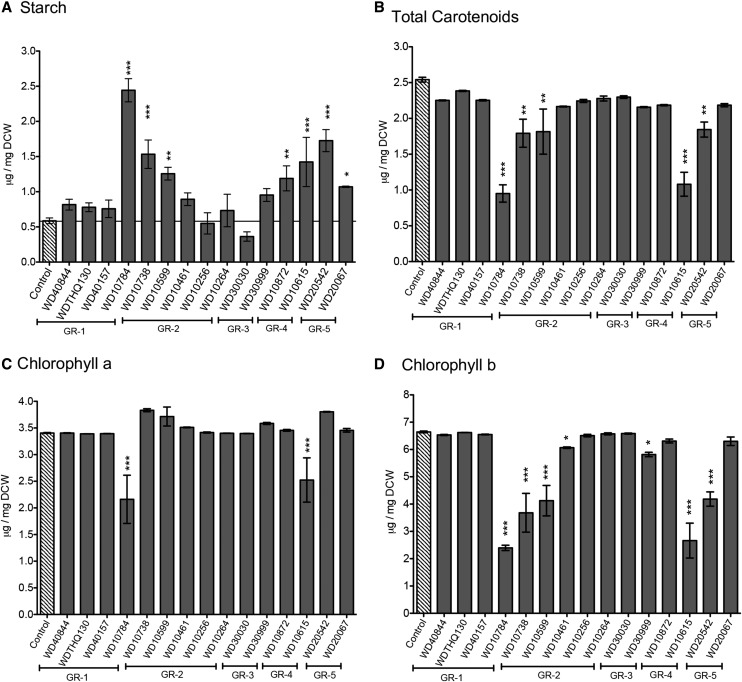
Figure 5.
Assessment of cellular macromolecule accumulation after treatment with selected compounds for 72 h. A, Total starch. B, Total carotenoids. C, Chlorophyll a. D, Chlorophyll b. Bar height indicates the mean of three independent experiments (±sd). Controls were values obtained for cultures treated with the vehicle, DMSO. ANOVA (JMP version 11) was applied to determine the significance of differences in the levels of total protein as compared with untreated control cells (N+; *, P < 0.05; **, P < 0.01; and ***, P < 0.001).

