
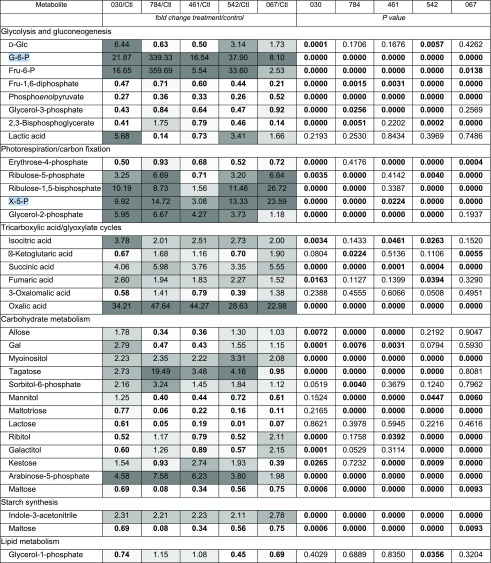
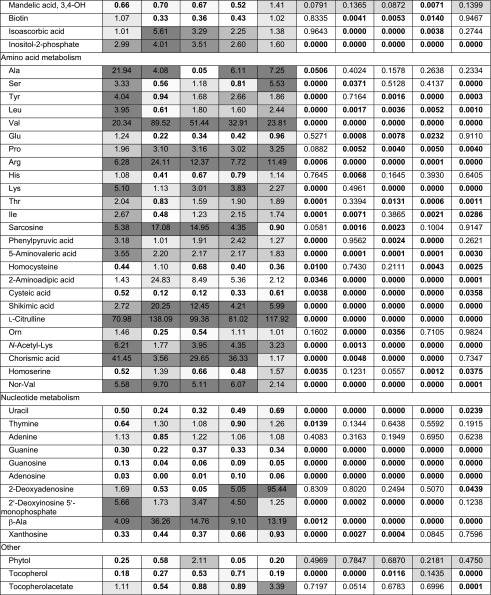
Table IV. Polar metabolites identified and compared between controls (Ctl) and compound-treated cells (WD30030, 030; WD10784, 784; WD10461, 461; WD20542, 542; WD20067, 067).
Bold font indicates significant P values (≤0.05).
|
Official websites use .gov
A
.gov website belongs to an official
government organization in the United States.
Secure .gov websites use HTTPS
A lock (
) or https:// means you've safely
connected to the .gov website. Share sensitive
information only on official, secure websites.
Bold font indicates significant P values (≤0.05).
|
|