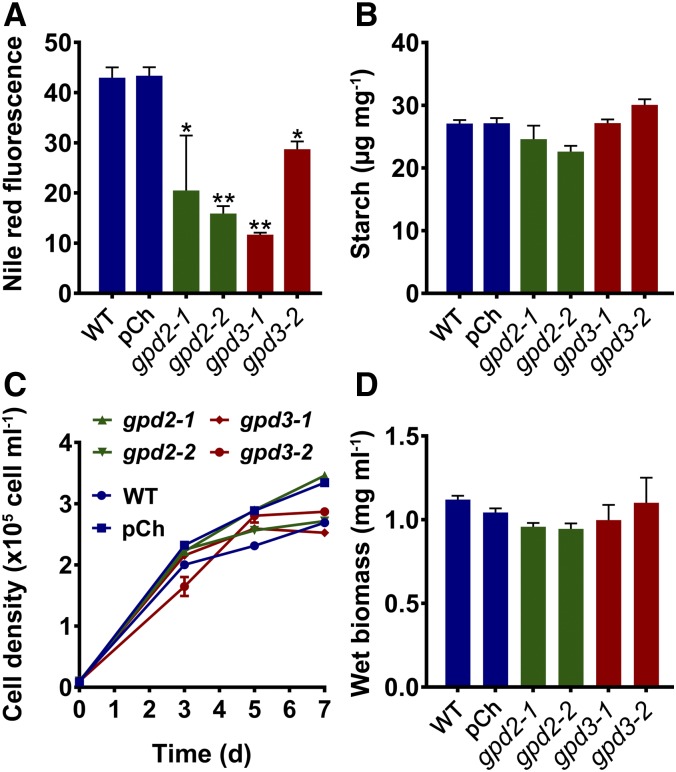
Figure 5.
Lipid, starch, and growth phenotypes of C. reinhardtii gpd2 and gpd3 knockdown lines in response to N starvation. A, Neutral lipid content after 7 d quantified by Nile Red fluorescence normalized by cell density. B, Starch concentration after 7 d determined on the basis of fresh weight biomass. C, Cell density of cultures grown over time. D, Fresh weight biomass after 7 d. Triplicate cultures of the CC-4351 cw15 wild type (WT), the pChlamiRNA (pCh) empty vector-transformed CC-4351, and the gpd2 and gpd3 knockdown lines were grown under N starvation conditions. Each data point represents the mean ± se. Asterisks indicate significant differences (*, P < 0.05 and **, P < 0.01) compared with the wild type as determined by one-way ANOVA.

