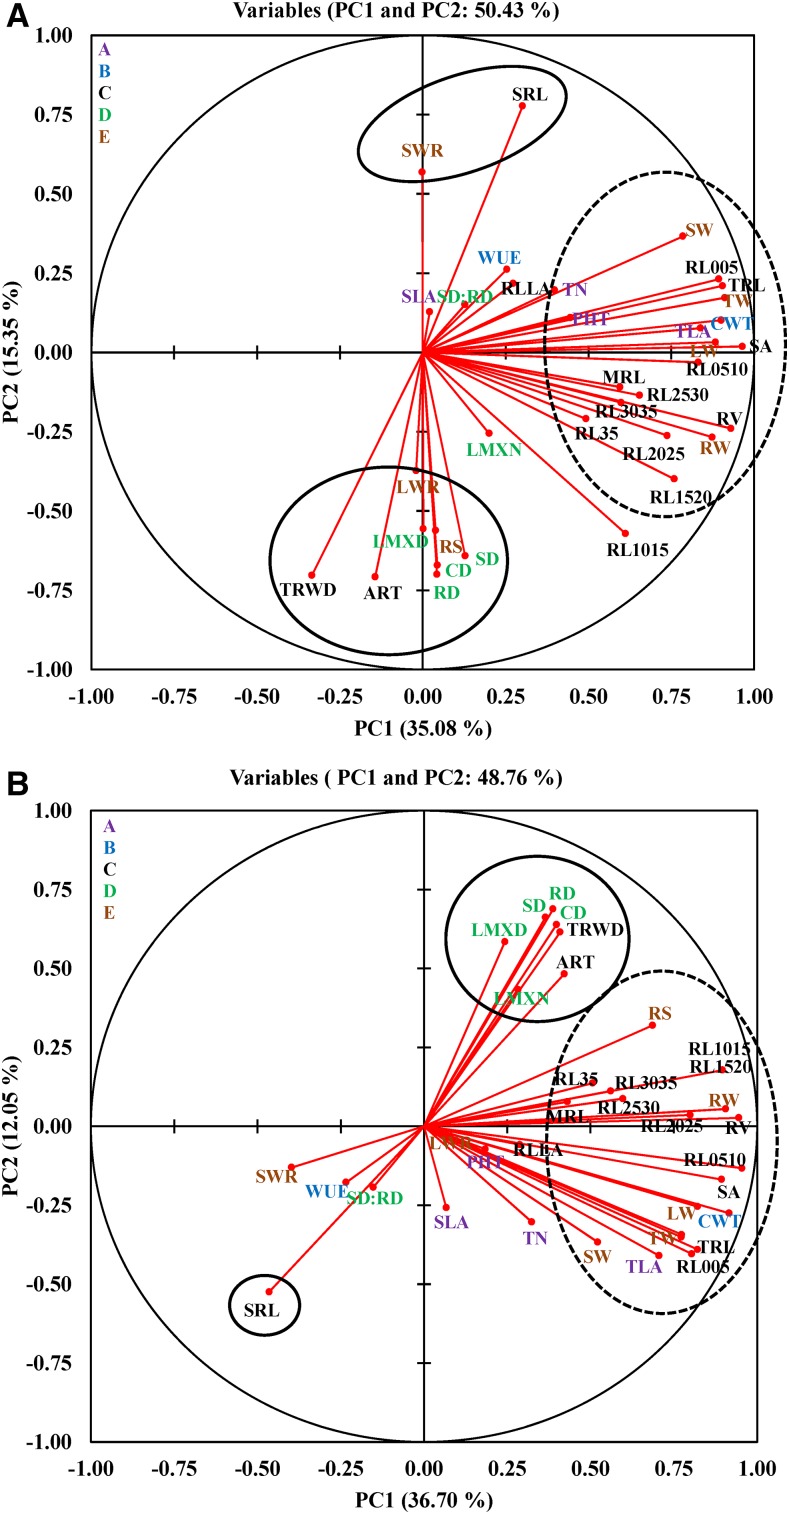
Figure 1.
PCA of the 35 traits with the first two components showing variation in control (A) and water-deficit stress (B) conditions. The traits marked by dashed ellipses contributed more to the variation explained by PC1, and those marked by solid circles/ellipses contributed more to the variation explained by PC2. Trait labels are colored differently according to category (uppercase letters) in Table I; acronyms are given in Table I.

