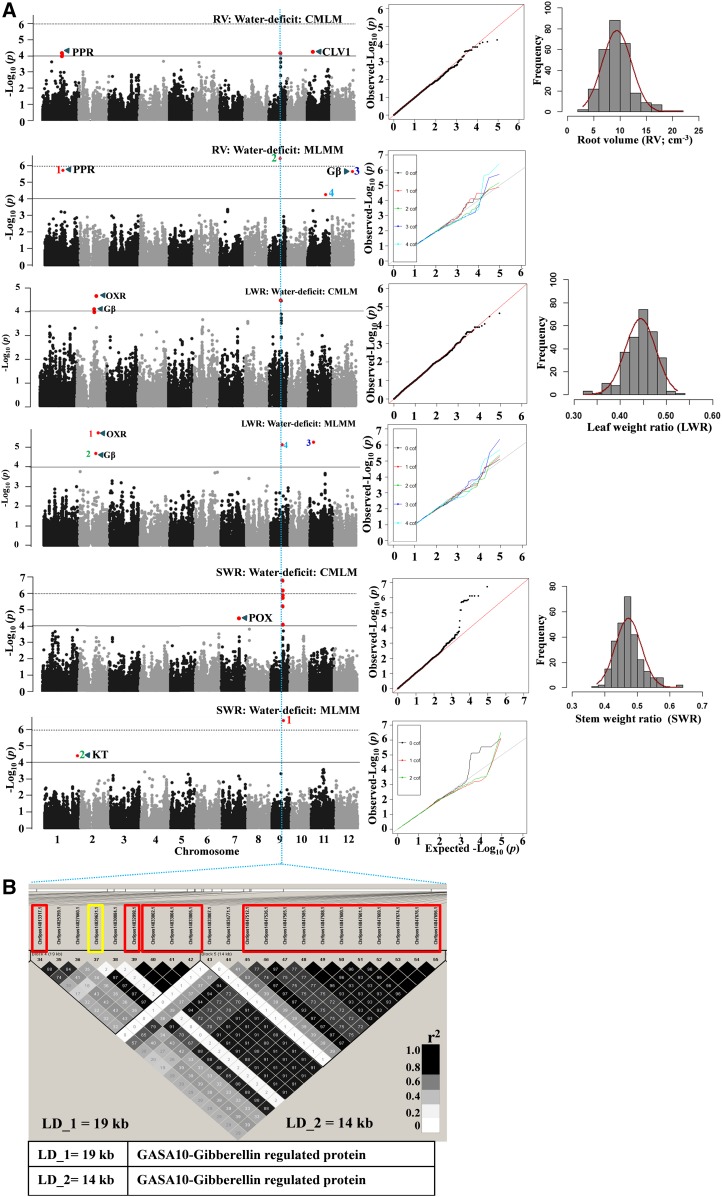
Figure 4.
A, GWAS results through the CMLM and MLMM approaches (Manhattan and quantile-quantile plots) for RV, LWR, and SWR in water-deficit stress. Significant SNPs (colored red in the Manhattan plots) are distinguished by threshold P value lines (solid black = −log10 P = 4 and dotted black = Bonferroni-corrected significance threshold). Significant SNPs on MLMM Manhattan plots are numbered in the order that they were included in the model as a cofactor. CLV1, CLAVATA1; Gβ, G-protein β-subunit; KT, potassium transporter; OXR, oxidoreductase; POX, peroxidase; PPR, pentatricopeptide. B, Identified LD blocks based on pairwise r2 values between SNPs on chromosome 9 with a priori candidate genes in the table below (for details, see Supplemental Tables S8 and S10). The color intensity of the box corresponds with the r2 value (multiplied by 100) according to the legend at right. A significant SNP (14829621) marked with the yellow rectangle was commonly associated with RV, LWR, and SWR.

