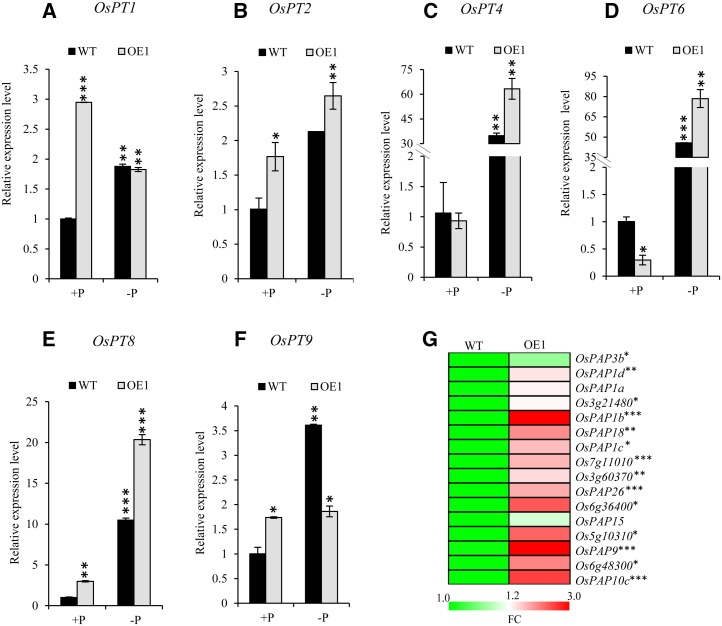
Figure 7.
Expression profiling of Pi transporters in wild-type (WT) and OsHAD1 transgenic plants. A to F, Relative expression levels are shown for OsPT1 (A), OsPT2 (B), OsPT4 (C), OsPT6 (D), OsPT8 (E), and OsPT9 (F) in roots of 30-d-old wild-type and OsHAD1 overexpression (OE1) plants raised under +P (320 µm) and −P (1 µm) conditions. qRT-PCR was used to determine gene expression, and relative expression level was calculated with respect to the expression level in roots of wild-type +P plants. Each bar represents an average of three replicates with sd. G, Heat map representing relative expression levels (fold change [FC]) of predicted secretory phosphatases/phytases in roots of 30-d-old OsHAD1 overexpression lines (OE1 and OE11) with respect to the wild type, raised under +P (320 µm). The heat map was generated with MEV 4.6.0. software. Significant changes were determined by Student’s t test. Asterisks indicate P ≤ 0.05 (*), P ≤ 0.01 (**), and P ≤ 0.001 (***).

