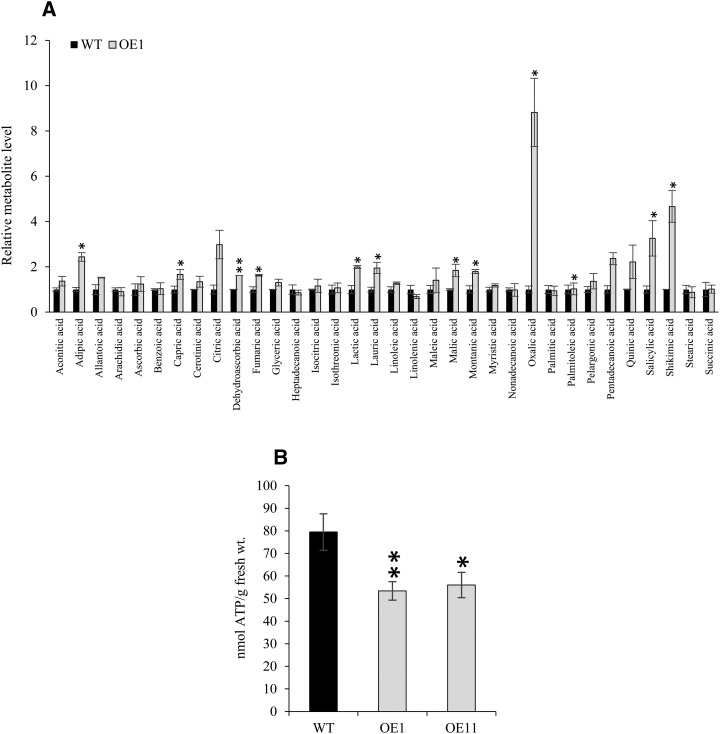
Figure 8.
Organic acid accumulation and ATP depletion in OsHAD1 overexpression lines. A, Relative metabolite levels (ratio of peak heights) in OsHAD1 OE lines with respect to the wild type (WT). Error bars indicate se from three biological replicates. B, ATP content in shoots of the wild type and OsHAD1 overexpression lines (OE1 and OE11). Analyses were carried out in 30-d-old hydroponically raised plants grown under +P conditions (320 µm NaH2PO4). Error bars indicate se from eight replicates. Significant differences in overexpression lines with respect to the wild type were determined by Student’s t test. Asterisks indicate P ≤ 0.05 (*) and P ≤ 0.01 (**).

