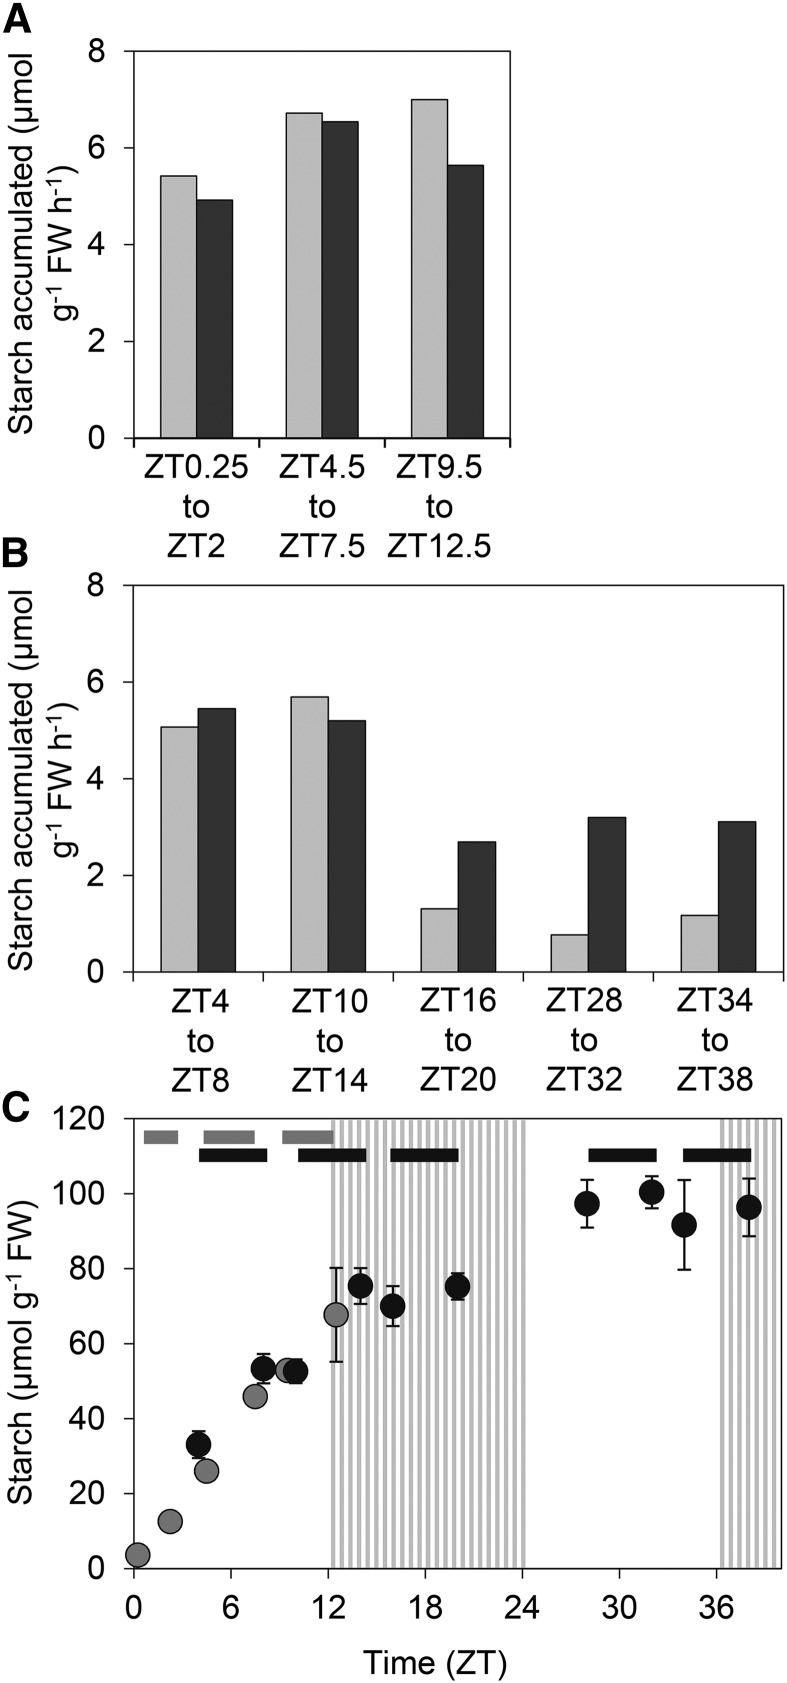
Figure 3.
Labeling of starch during pulses of 13CO2. Plants were grown for 21 d in 12-h-light/12-h-dark cycles at 160 µmol m−2 s−1. On the day of the experiment, starting at dawn, plants were transferred to continuous light. A, Rate of accumulation of total starch (light gray bars) and 13C starch (dark gray bars) during pulses of 13CO2 over the time intervals indicated (see also C). Rates were calculated from measurements of total starch content and 13C starch content at the beginning and end of each pulse (see Supplemental Text S1, Part I). Original data are in Supplemental Table S1A. B, As for A, but an independent experiment over an extended period in continuous light. Original data are in Supplemental Table S1B. C, Total starch accumulation over the periods of the experiments shown in A (light-gray symbols) and B (dark-gray symbols). Bars at the top indicate the pulse periods in A (gray) and B (black). Striped zones represent the subjective nights. Values are means ± sd of measurements on three or four pots of plants, each of which contained five individuals.

