
Figure 5.
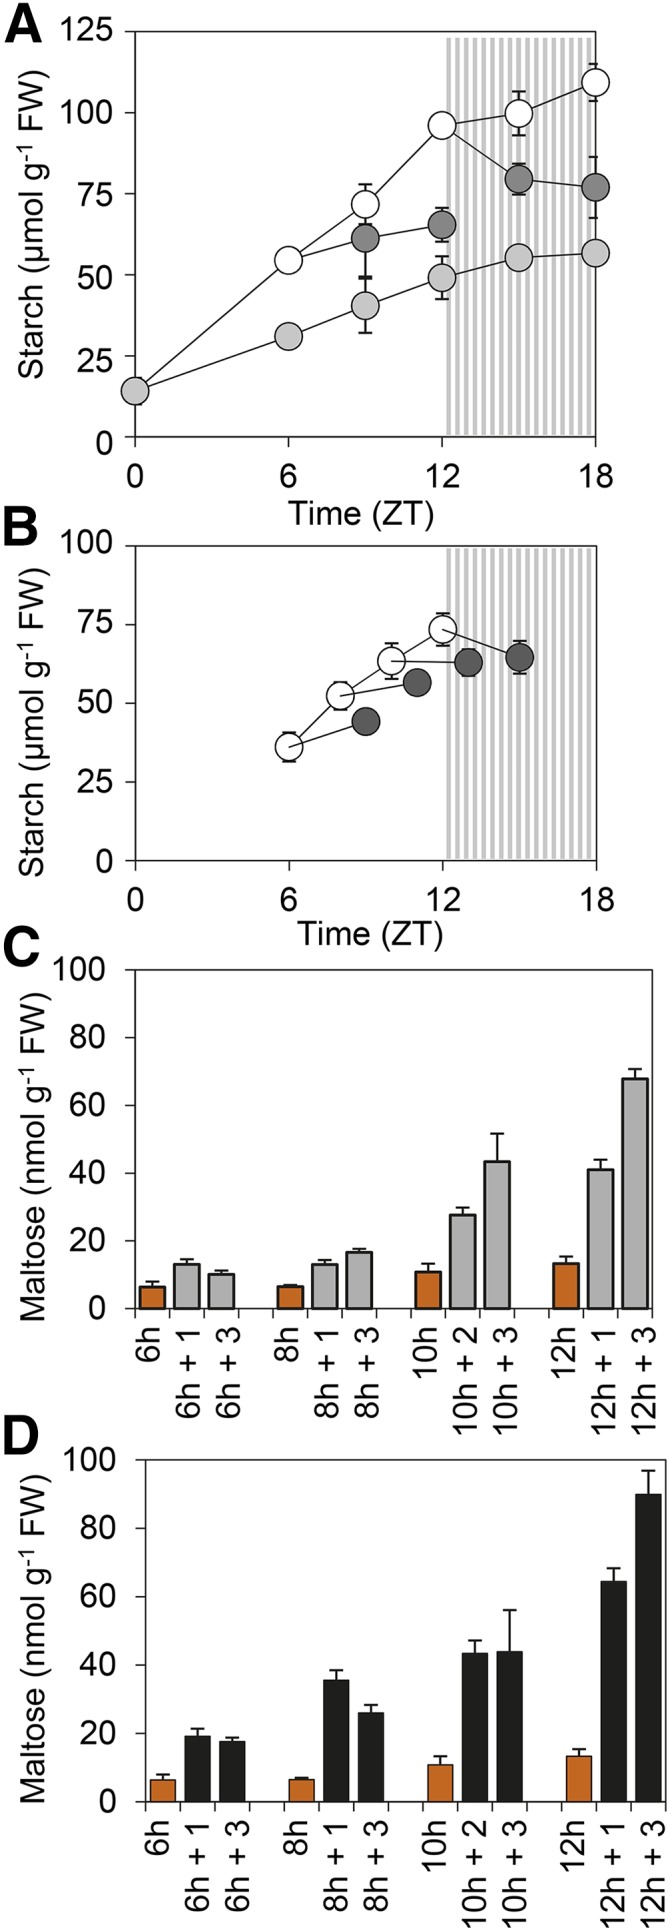
Starch and maltose accumulation in response to decreases in light intensity. Plants grown under 12-h-light/12-h-dark at ∼150 µmol m−2 s−1 for 21 d were transferred to continuous light at dawn and then subjected to decreases in light intensity at specific time points. A, Starch contents of plants subjected to a decrease in light intensity from 170 (white symbols) to 105 µmol m−2 s−1 at ZT6 and ZT12 (dark-gray symbols) or subjected to 105 µmol m−2 s−1 continuously from dawn (light-gray symbols). B, Starch contents of plants subjected to a reduction in irradiance from 105 (white symbols) to 65 µmol m−2 s−1 at ZT6, 8, 10, or 12 (dark-gray symbols). C, Maltose contents of plants subjected to the same reductions in light intensity as in B, harvested immediately prior to the reduction (orange) or at 1 or 3 h following the reduction (gray). D, As for C except plants were subjected to complete darkness at ZT6, 8, 10, or 12 and harvested at 1 or 3 h following the onset of darkness (black). Striped zones in A and B represent the subjective night. Values are means ± sd of measurements on six rosettes.