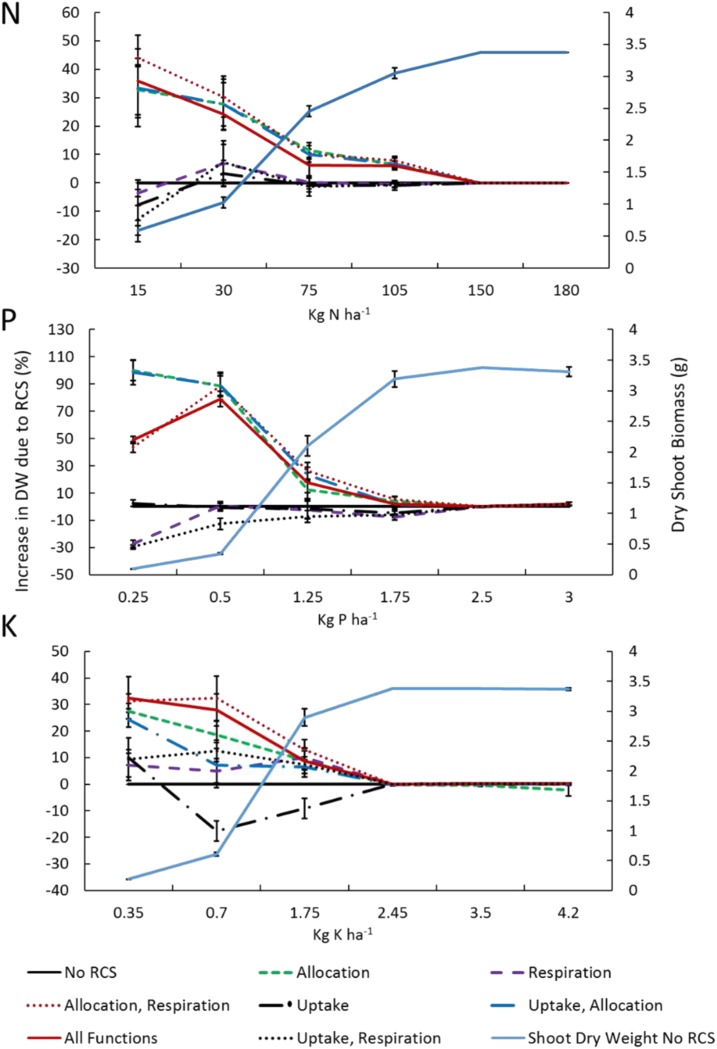
Figure 2.
Utility of RCS formation under varying availability of nitrogen, phosphorus, and potassium dissolved in solution at the start of the simulation. Total phosphorus and potassium concentrations are greater due to the buffering capacity (P, 400; and K, 10). On the y axis, the utility of RCS is expressed as a percentage increase in plant dry weight (DW) at 80 DAG. On the secondary y axis, dry shoot biomass is presented for a plant with no RCS. Relative shoot dry biomass was calculated as 100 × (XRCS − XnoRCS)/XnoRCS. Different lines show the utility for different functions (allocation, respiration, and uptake) of RCS. Error bars represent se for four repeated runs. Simulated stochasticity in root growth rates, directions, and branching density causes variation.

