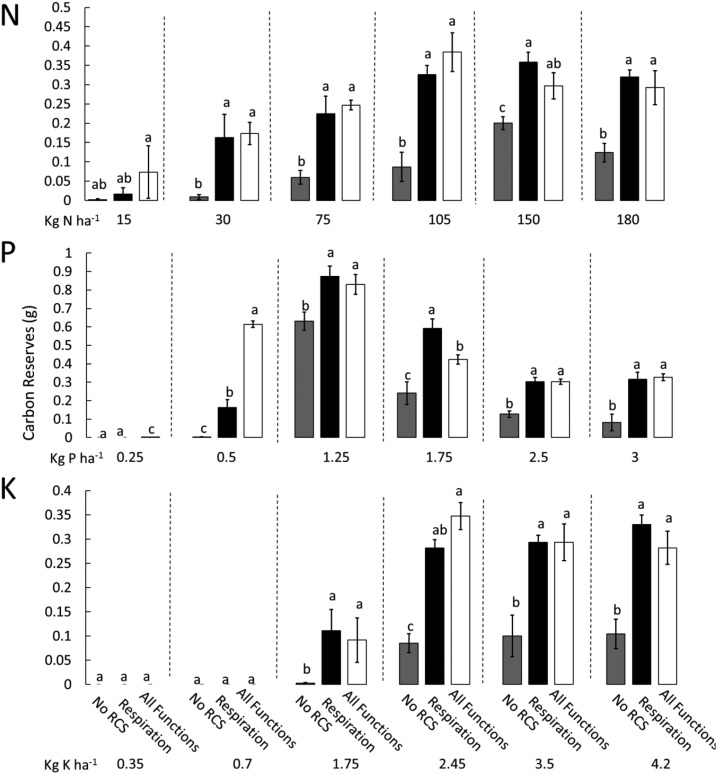
Figure 5.
Effects of the RCS respiration function on plant carbon reserves. Different bars show the utility for different functions of RCS under varying nitrogen, phosphorus, and potassium availability. The total amount of carbon reserves in the shoot at 80 DAG is represented on the x axis. Error bars represent se (see Fig. 2 for explanation). Different letters within the same graph represent significant differences within that graph as determined by Tukey’s test (P < 0.05).

