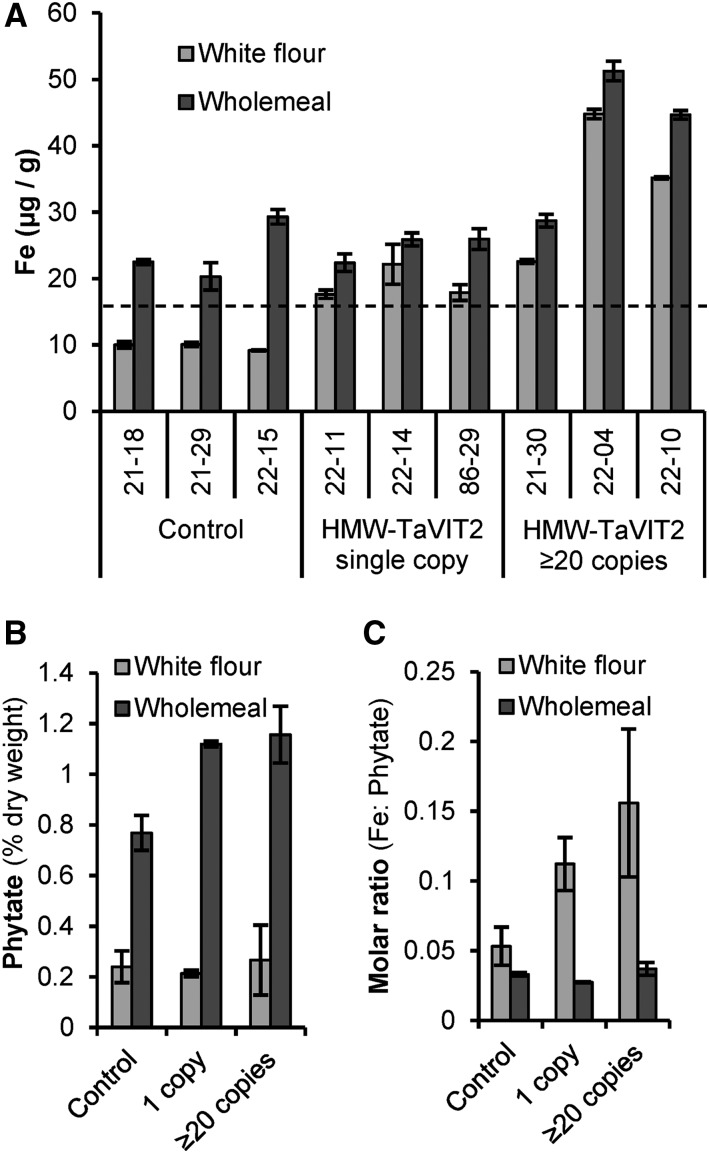
Figure 5.
Iron and phytate content of flour milled from HMW-TaVIT2 wheat lines. A, Iron concentrations in white and whole-meal flour from three control and six HMW-TaVIT2 lines. Bars represent means of two technical replicates ± sd. White flour from HMW-TaVIT2 lines has significantly more iron than that from control lines (n = 3–4, P < 0.001; for all data, see Supplemental Table S3). The dotted line at 16.5 μg g−1 iron indicates the minimum requirement for wheat flour sold in the United Kingdom. B, Phytate content of white and whole-meal flour of control and HMW-TaVIT2-expressing wheat. Bars represent means of two biological replicates ± sd. C, Molar ratio of iron to phytate in control and HMW-TaVIT2-expressing lines. Bars represent means of two biological replicates ± sd.

