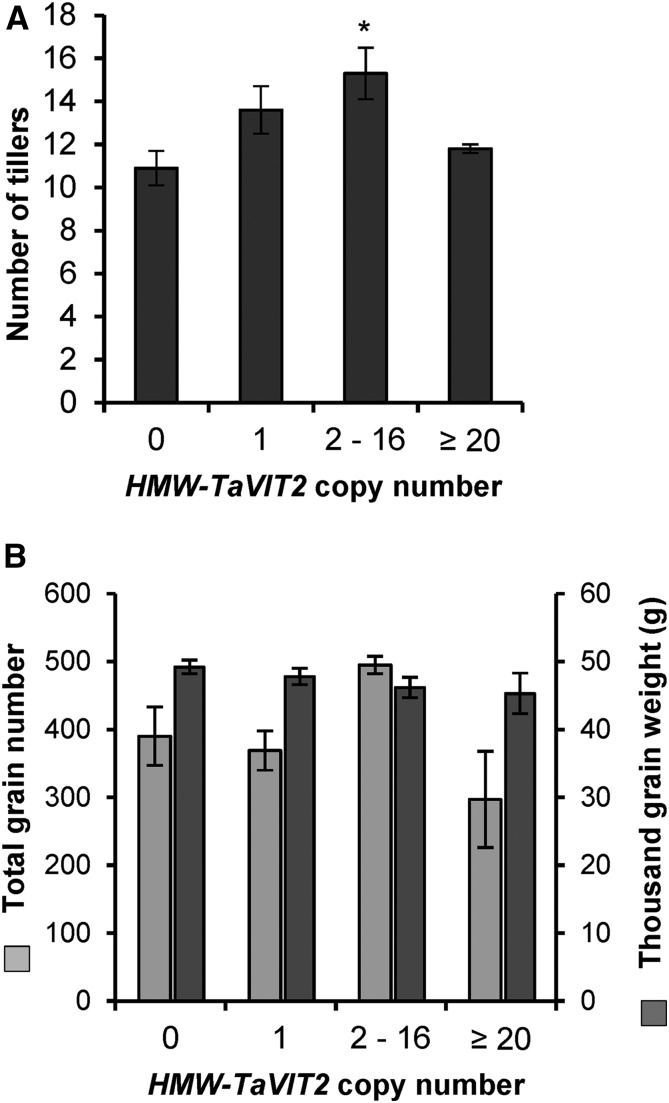
Figure 6.
Growth parameters of HMW-TaVIT2 wheat. The number of tillers (A) and seed output (B) of T0 wheat plants with indicated HMW-TaVIT2 copy numbers are shown. Bars indicate means ± se of the following numbers of biological replicates: zero gene copies, n = 9; one gene copy, n = 10; two to 16 gene copies, n = 9; 20 or more gene copies, n = 6. Further details are given in Supplemental Table S5. The asterisk indicates a significant difference from the negative control (one-way ANOVA with Tukey’s posthoc test: *, P < 0.05).

