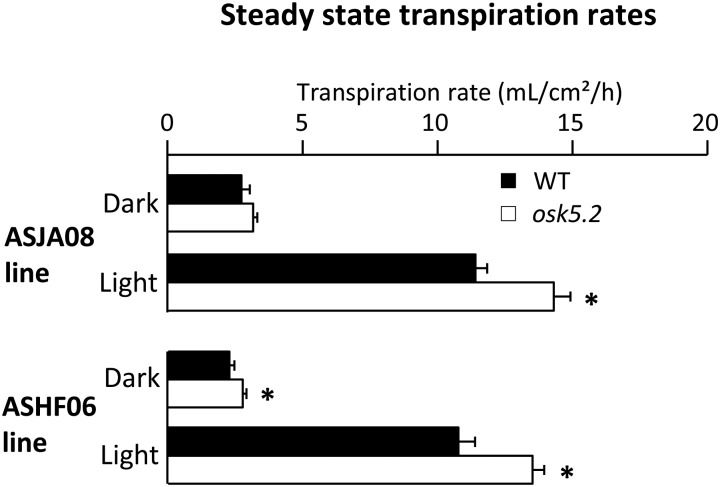
Figure 4.
Steady-state transpiration rates in wild-type control and osk5.2 mutant plants. Five-week-old plants issued from the initial ASJA08 line (above) or ASHF06 line (below) were used for steady-state transpiration rate analyses in dark (∼5 h after light was switched off) and in light (∼3 h after light was switched on) conditions. The steady-state transpiration rate (in mL/cm2/h) was determined by dividing the average speed of water loss at steady state (mean of three values) by the total area of the plant aerial parts. Black and white bars represent wild-type control and osk5.2 mutant plants, respectively. Data are means ± se; n = 6 for wild-type control and 13 for osk5.2 mutant plants in the case of the plants issued from the ASJA08 line, and n = 7 for wild-type control and 9 for osk5.2 plant plants in the case of the plants issued from the ASHF06 line. An asterisk indicates that the corresponding difference between the wild-type control and mutant plants was statistically significant (Student’s t test, P < 0.05).

