Figure 5.
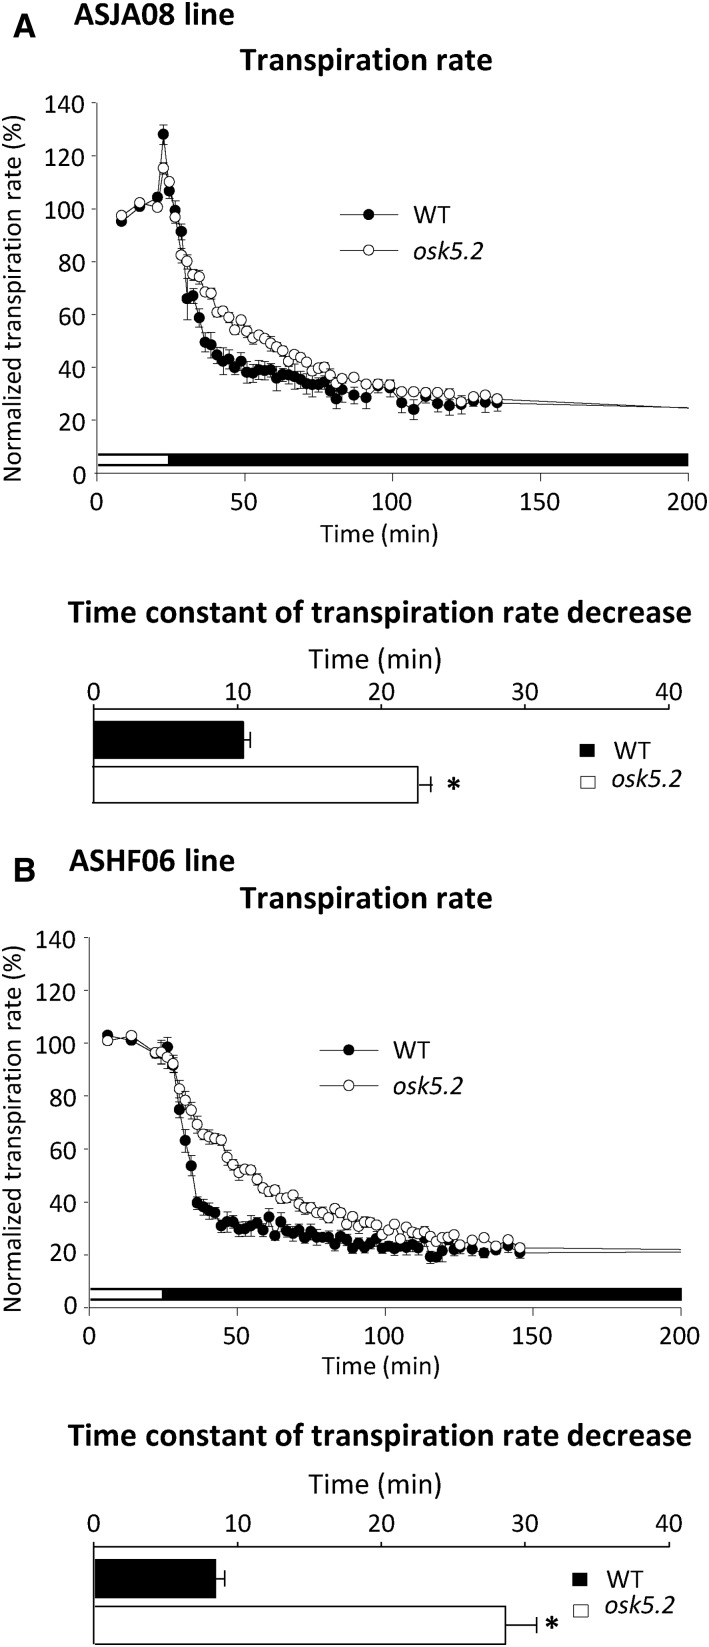
Kinetics of the decrease in transpiration rate upon dark-induced stomatal closure in wild-type and osk5.2 mutant plants. A and B, Kinetics (top) and time constant (bottom) of the dark-induced decrease in transpiration rate in wild-type control (black circle, black square) and osk5.2 mutant (white circle, white square) plants issued from the initial ASJA08 (A) or ASHF06 (B) lines in standard Yoshida hydroponic solution. The light was switched off after 30 min of recording under light condition as indicated by the change from white to black in the bar below the graph. Transpiration rates were normalized by dividing absolute transpiration rates by the steady-state transpiration rate in light condition and are presented as percentages (%). Time constants were derived by fitting the experimental dark-induced transpiration rate decrease kinetics with an exponential function (least-squares fitting). Black and white bars correspond to wild-type control and osk5.2 mutant plants, respectively. Data are means ± se; n = 6 for wild-type control and 13 for osk5.2 mutant plants in A, and n = 7 for wild-type control and 9 for osk5.2 mutant plants in B. The asterisks indicate that the corresponding differences between the wild-type control and mutant plants were statistically significant (Student’s t test, P < 0.05).

