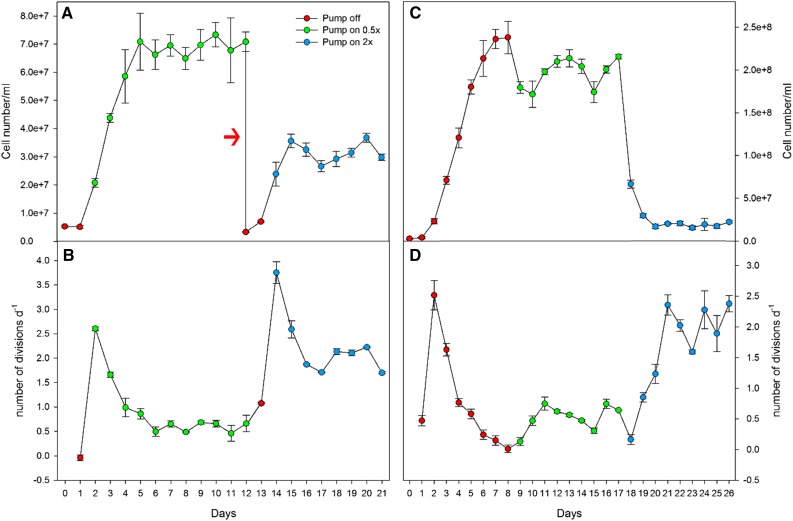
Figure 5.
Experimental setups to test the effects of cell density on Synechocystis growth. Growth cycle and daily number of divisions are shown for cultures grown in fed-batch condition starting at low cell density (A and B) and high cell density (C and D). The red arrow in A indicates that cultures were diluted to the same initial density of day 0.

