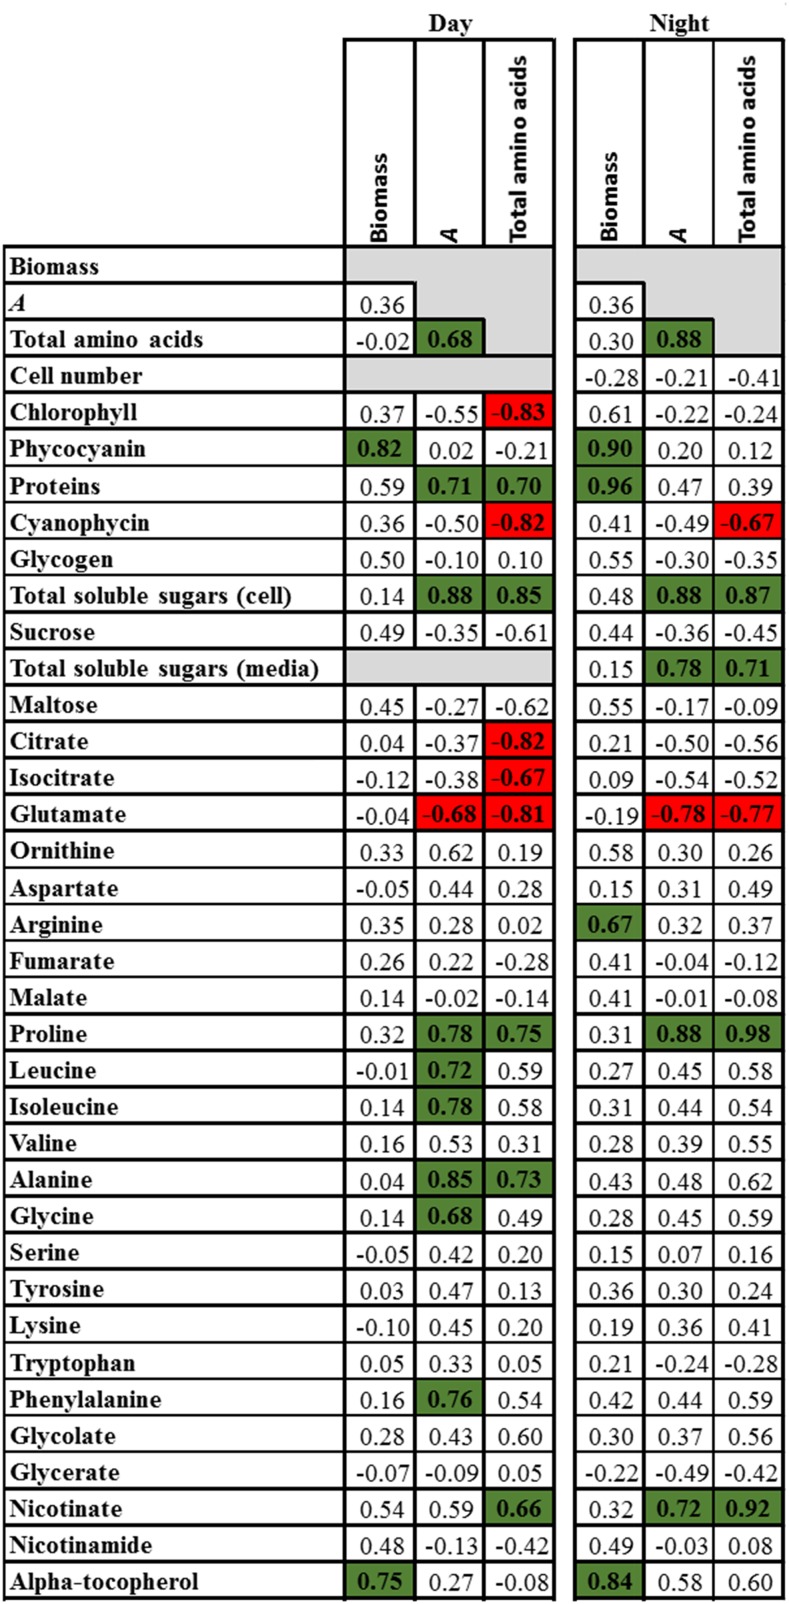
Figure 8.
Spearman’s rank coefficient of correlation between biomass, photosynthetic rate (A), and total amino acids, and metabolite levels determined at ED and EN in cells 3 d after the onset of the stationary phase. Total soluble sugars (medium) was determined only at EN. Significant correlations at 5% probability are highlighted in green (positive) and red (negative). Additional correlations between all growth, physiologic, metabolic, and molecular traits are presented in Supplemental Figure S12.

